OldVisOnline: Curating a Dataset of Historical Visualizations
Publication
Metrics
AI Quick Summary
This paper curates a large-scale dataset of 13K historical visualization images from seven digital libraries, addressing the lack of a dedicated collection. The authors propose a workflow for scraping and processing metadata and develop a semi-automatic labeling approach, accessible via the OldVisOnline system for browsing and further labeling.
Paper Preview
Abstract
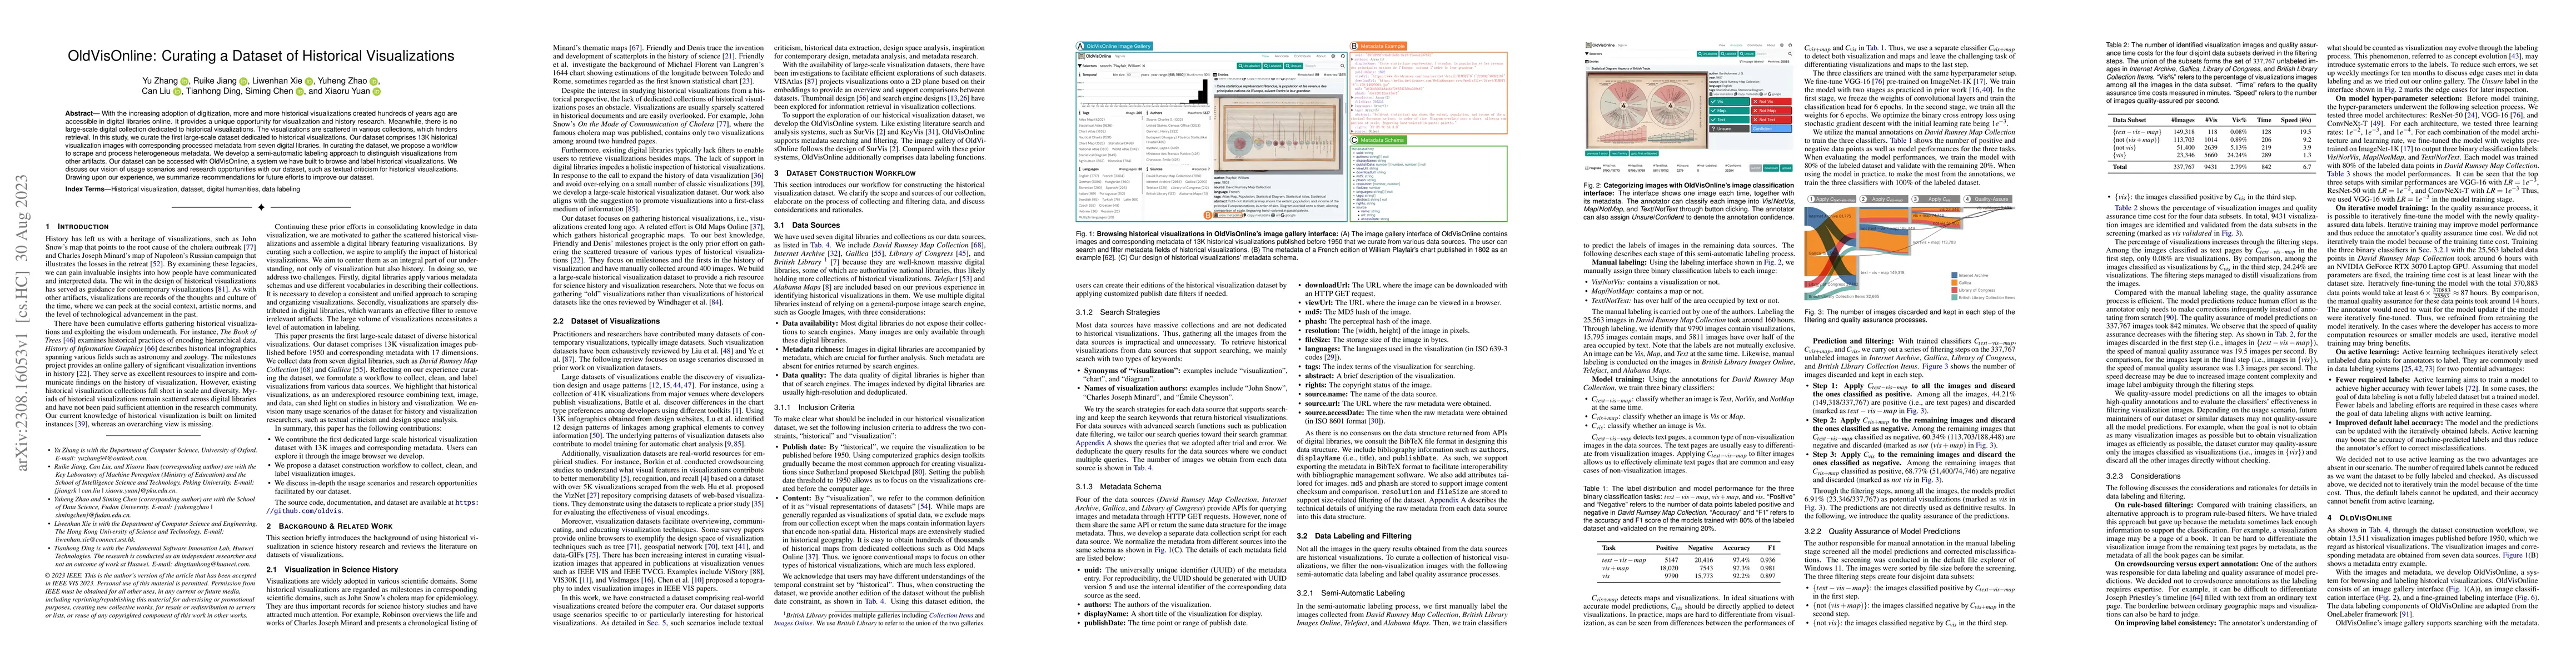
With the increasing adoption of digitization, more and more historical visualizations created hundreds of years ago are accessible in digital libraries online. It provides a unique opportunity for visualization and history research. Meanwhile, there is no large-scale digital collection dedicated to historical visualizations. The visualizations are scattered in various collections, which hinders retrieval. In this study, we curate the first large-scale dataset dedicated to historical visualizations. Our dataset comprises 13K historical visualization images with corresponding processed metadata from seven digital libraries. In curating the dataset, we propose a workflow to scrape and process heterogeneous metadata. We develop a semi-automatic labeling approach to distinguish visualizations from other artifacts. Our dataset can be accessed with OldVisOnline, a system we have built to browse and label historical visualizations. We discuss our vision of usage scenarios and research opportunities with our dataset, such as textual criticism for historical visualizations. Drawing upon our experience, we summarize recommendations for future efforts to improve our dataset.
AI Key Findings
Get AI-generated insights about this paper's methodology, results, significance, and more — seven facets brought into focus.
Impact
Paper Details
Authors
PDF Preview
Key Terms
Citation Network
Current paper (gray), citations (green), references (blue)
Display is limited for performance on very large graphs.
Discussion 0