01
MethodologyHow they did it
MAP perturbation sampling is used to target the most plausible structures in high-dimensional complex models.
This paper develops new measure concentration inequalities to estimate the expected value of low-dimensional maximum a-posteriori (MAP) perturbations, aiming to reduce the computational cost of generating high-dimensional random samples. The results may also benefit other areas requiring efficient expected value estimations.
This paper develops new measure concentration inequalities to estimate the expected value of low-dimensional maximum a-posteriori (MAP) perturbations, aiming to reduce the computational cost of generating high-dimensional random samples. The results may also benefit other areas requiring efficient expected value estimations.
MAP perturbation sampling is used to target the most plausible structures in high-dimensional complex models. More in Methodology →
The expected value of Vj under MAP perturbations can be estimated with high probability using M=1, 5, or 10 samples. — The measure concentration properties of MAP perturbations ensure exponential decay for any dimension. More in Key Results →
Sampling from the Gibbs distribution is crucial in high-dimensional complex models. MAP perturbation sampling provides a promising alternative. More in Significance →
The method may not work well for certain types of data or models. — The dimensionality of the model can significantly impact the performance of the algorithm. More in Limitations →
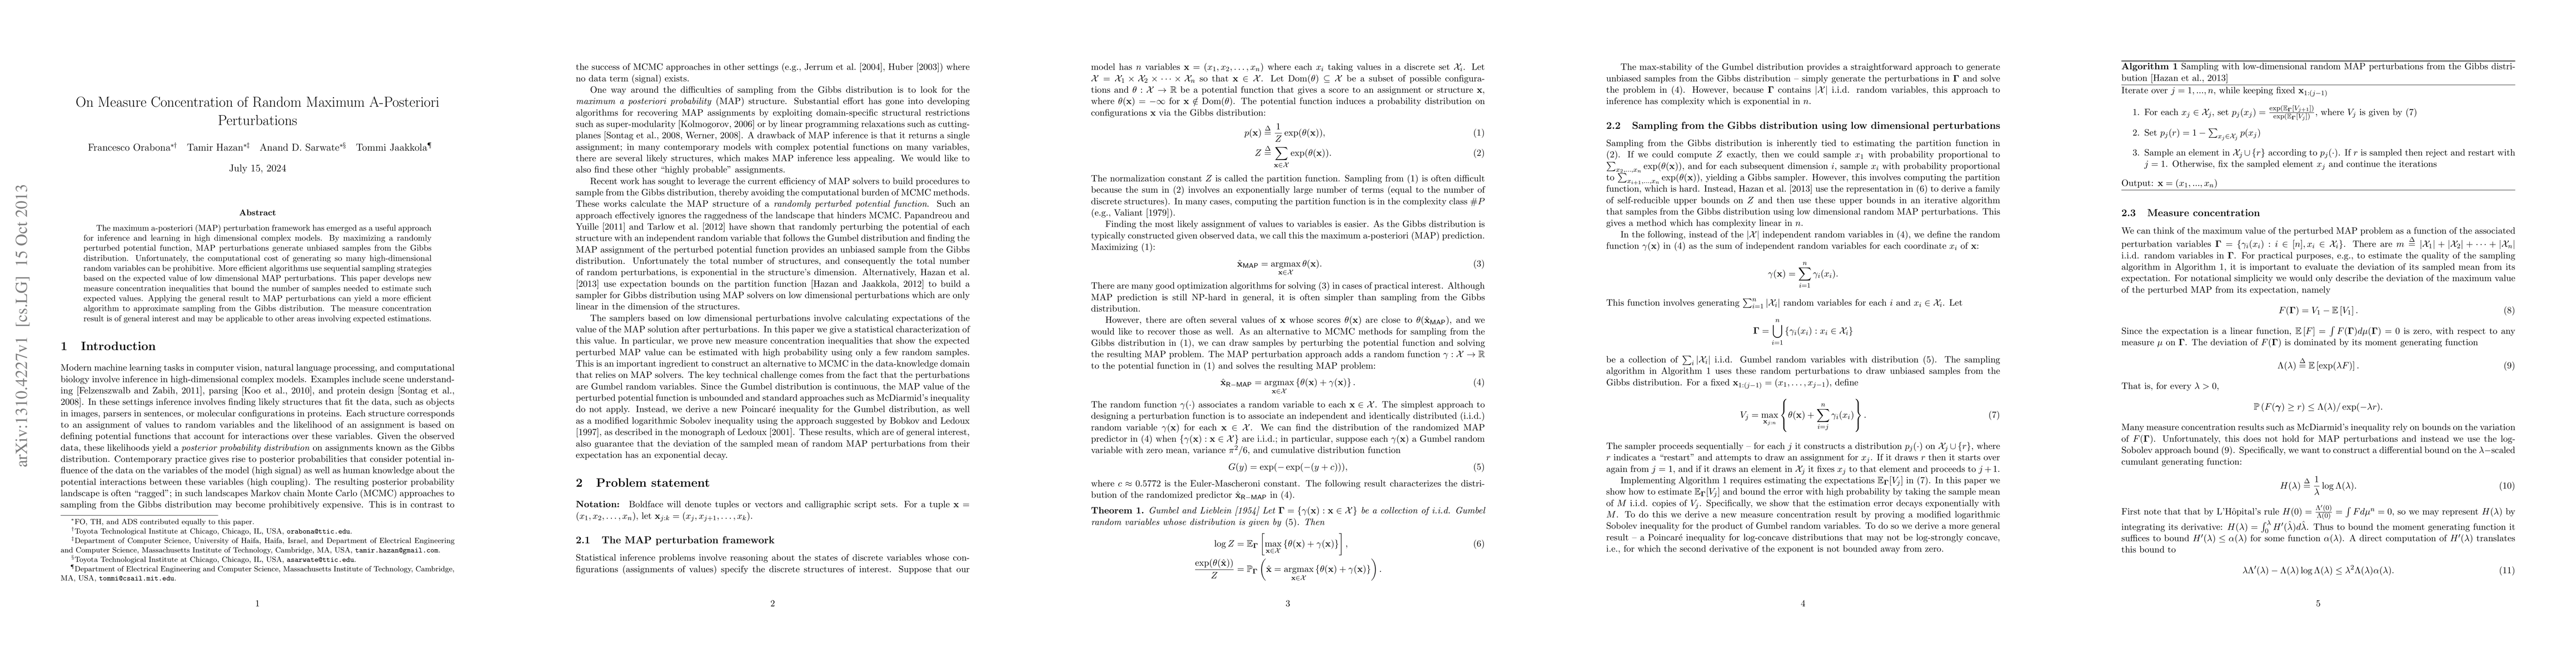
The maximum a-posteriori (MAP) perturbation framework has emerged as a useful approach for inference and learning in high dimensional complex models. By maximizing a randomly perturbed potential function, MAP perturbations generate unbiased samples from the Gibbs distribution. Unfortunately, the computational cost of generating so many high-dimensional random variables can be prohibitive. More efficient algorithms use sequential sampling strategies based on the expected value of low dimensional MAP perturbations. This paper develops new measure concentration inequalities that bound the number of samples needed to estimate such expected values. Applying the general result to MAP perturbations can yield a more efficient algorithm to approximate sampling from the Gibbs distribution. The measure concentration result is of general interest and may be applicable to other areas involving expected estimations.
Seven facets of this paper, analysed and brought into focus by AI.
Sampling from the Gibbs distribution is crucial in high-dimensional complex models.
MAP perturbation sampling is used to target the most plausible structures in high-dimensional complex models.
Sampling from the Gibbs distribution is crucial in high-dimensional complex models. MAP perturbation sampling provides a promising alternative.
The work provides a new approach to sampling from high-dimensional complex models using MAP perturbation sampling.
The method is novel because it targets the most plausible structures directly, unlike traditional MCMC methods.
Current paper (gray), citations (green), references (blue)
Display is limited for performance on very large graphs.
Discussion 0