On Quantitative Evaluations of Counterfactuals
Publication
Metrics
Paper Preview
Abstract
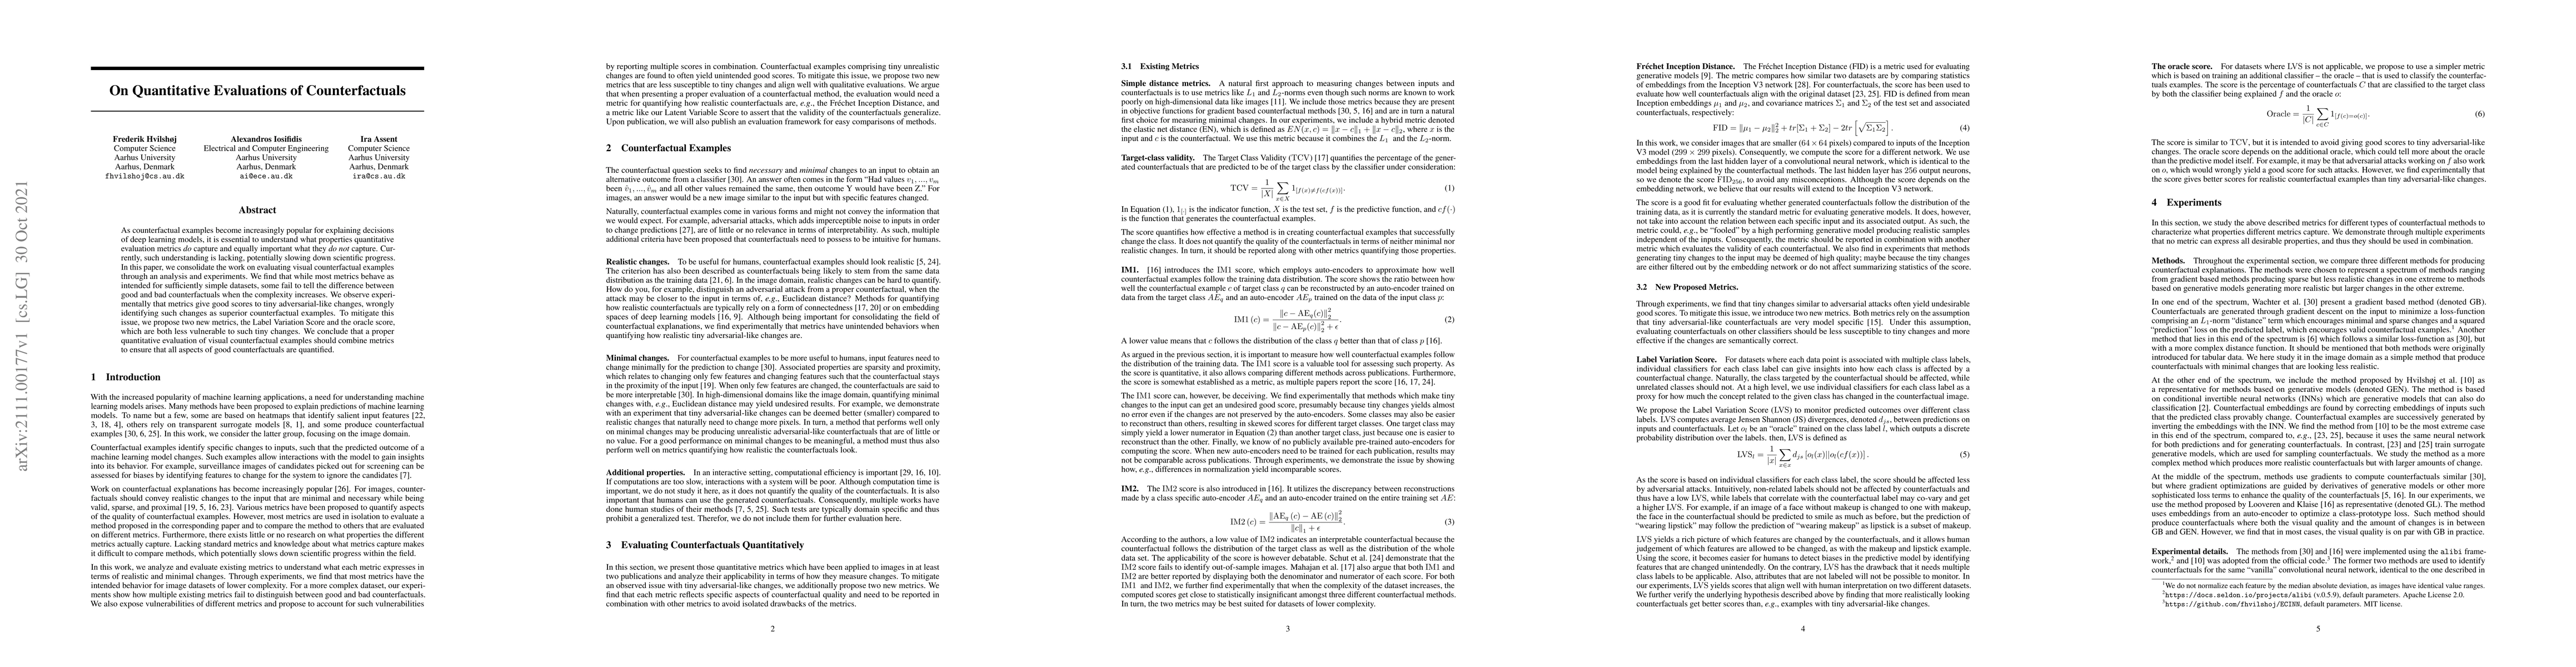
As counterfactual examples become increasingly popular for explaining decisions of deep learning models, it is essential to understand what properties quantitative evaluation metrics do capture and equally important what they do not capture. Currently, such understanding is lacking, potentially slowing down scientific progress. In this paper, we consolidate the work on evaluating visual counterfactual examples through an analysis and experiments. We find that while most metrics behave as intended for sufficiently simple datasets, some fail to tell the difference between good and bad counterfactuals when the complexity increases. We observe experimentally that metrics give good scores to tiny adversarial-like changes, wrongly identifying such changes as superior counterfactual examples. To mitigate this issue, we propose two new metrics, the Label Variation Score and the Oracle score, which are both less vulnerable to such tiny changes. We conclude that a proper quantitative evaluation of visual counterfactual examples should combine metrics to ensure that all aspects of good counterfactuals are quantified.
AI Key Findings
Get AI-generated insights about this paper's methodology, results, significance, and more — seven facets brought into focus.
Impact
Paper Details
Authors
PDF Preview
Key Terms
Citation Network
Current paper (gray), citations (green), references (blue)
Display is limited for performance on very large graphs.
Discussion 0