On Ridge Estimation in High-dimensional Rotationally Sparse Linear Regression
Publication
Metrics
AI Quick Summary
This paper investigates the ridge estimator in high-dimensional rotationally sparse linear regression, establishing bounds on prediction errors in two distinct regimes based on the ratio of effective rank to sample size. It reveals that prediction errors can be $O(\frac{d}{n})$ if the variance gap between significant and minor covariates is sufficiently large, and highlights that optimal out-sample prediction errors can be smaller than in-sample ones.
Paper Preview
Abstract
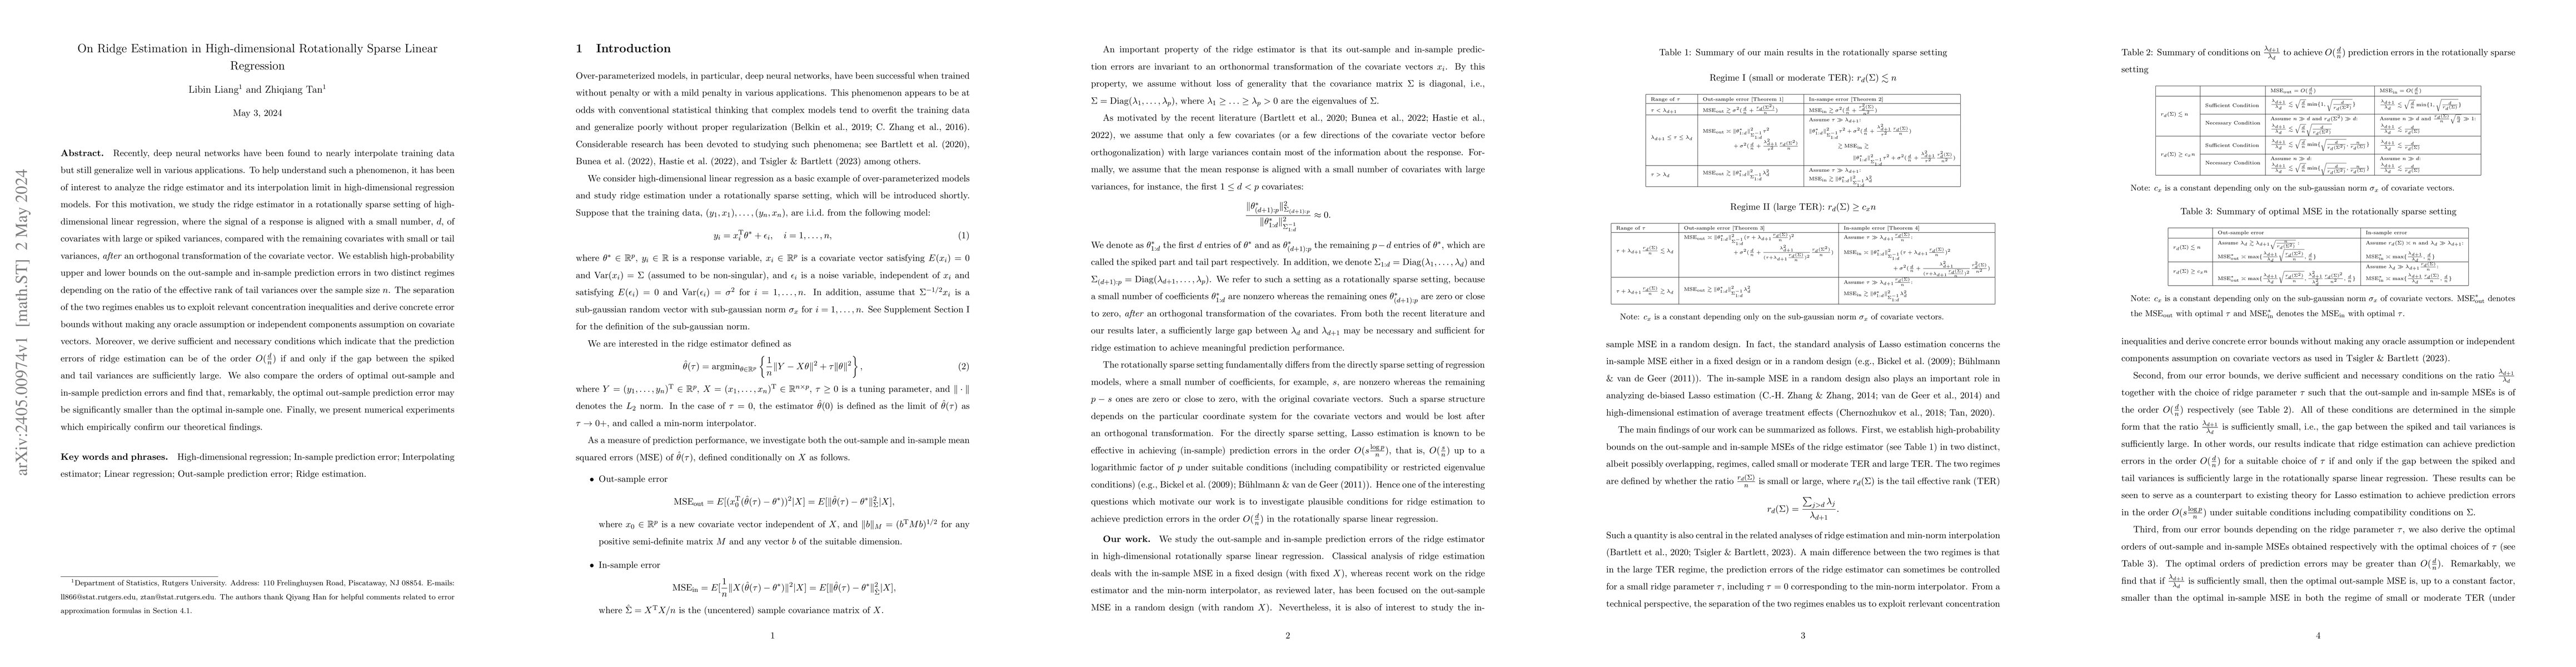
Recently, deep neural networks have been found to nearly interpolate training data but still generalize well in various applications. To help understand such a phenomenon, it has been of interest to analyze the ridge estimator and its interpolation limit in high-dimensional regression models. For this motivation, we study the ridge estimator in a rotationally sparse setting of high-dimensional linear regression, where the signal of a response is aligned with a small number, $d$, of covariates with large or spiked variances, compared with the remaining covariates with small or tail variances, \textit{after} an orthogonal transformation of the covariate vector. We establish high-probability upper and lower bounds on the out-sample and in-sample prediction errors in two distinct regimes depending on the ratio of the effective rank of tail variances over the sample size $n$. The separation of the two regimes enables us to exploit relevant concentration inequalities and derive concrete error bounds without making any oracle assumption or independent components assumption on covariate vectors. Moreover, we derive sufficient and necessary conditions which indicate that the prediction errors of ridge estimation can be of the order $O(\frac{d}{n})$ if and only if the gap between the spiked and tail variances are sufficiently large. We also compare the orders of optimal out-sample and in-sample prediction errors and find that, remarkably, the optimal out-sample prediction error may be significantly smaller than the optimal in-sample one. Finally, we present numerical experiments which empirically confirm our theoretical findings.
AI Key Findings
Get AI-generated insights about this paper's methodology, results, significance, and more — seven facets brought into focus.
Paper Details
Authors
PDF Preview
Key Terms
Related Papers
No references found for this paper.
Discussion 0