Summary
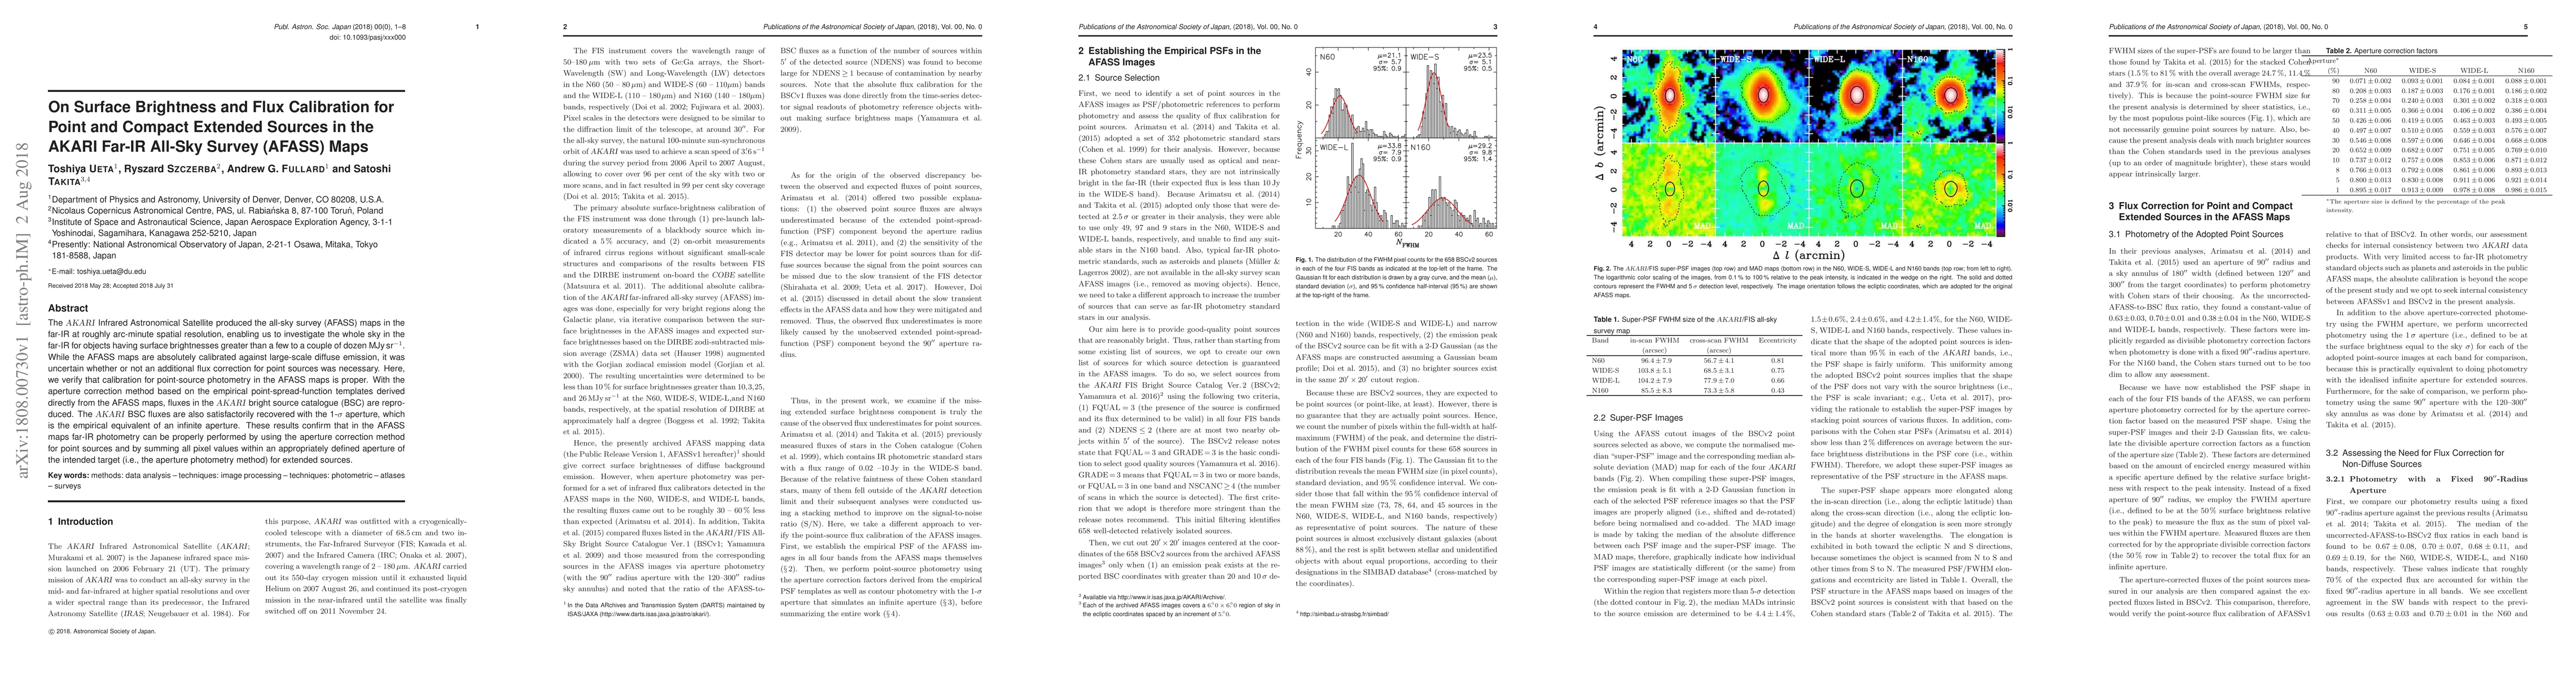
The AKARI Infrared Astronomical Satellite produced the all-sky survey (AFASS) maps in the far-IR at roughly arc-minute spatial resolution, enabling us to investigate the whole sky in the far-IR for objects having surface brightnesses greater than a few to a couple of dozen MJy/sr. While the AFASS maps are absolutely calibrated against large-scale diffuse emission, it was uncertain whether or not an additional flux correction for point sources was necessary. Here, we verify that calibration for point-source photometry in the AFASS maps is proper. With the aperture correction method based on the empirical point-spread-function templates derived directly from the AFASS maps, fluxes in the AKARI bright source catalogue (BSC) are reproduced. The AKARI BSC fluxes are also satisfactorily recovered with the 1 sigma aperture, which is the empirical equivalent of an infinite aperture. These results confirm that in the AFASS maps far-IR photometry can be properly performed by using the aperture correction method for point sources and by summing all pixel values within an appropriately defined aperture of the intended target (i.e., the aperture photometry method) for extended sources.
AI Key Findings
Get AI-generated insights about this paper's methodology, results, and significance.
Paper Details
PDF Preview
Key Terms
Citation Network
Current paper (gray), citations (green), references (blue)
Display is limited for performance on very large graphs.
| Title | Authors | Year | Actions |
|---|
Comments (0)