Authors
Summary
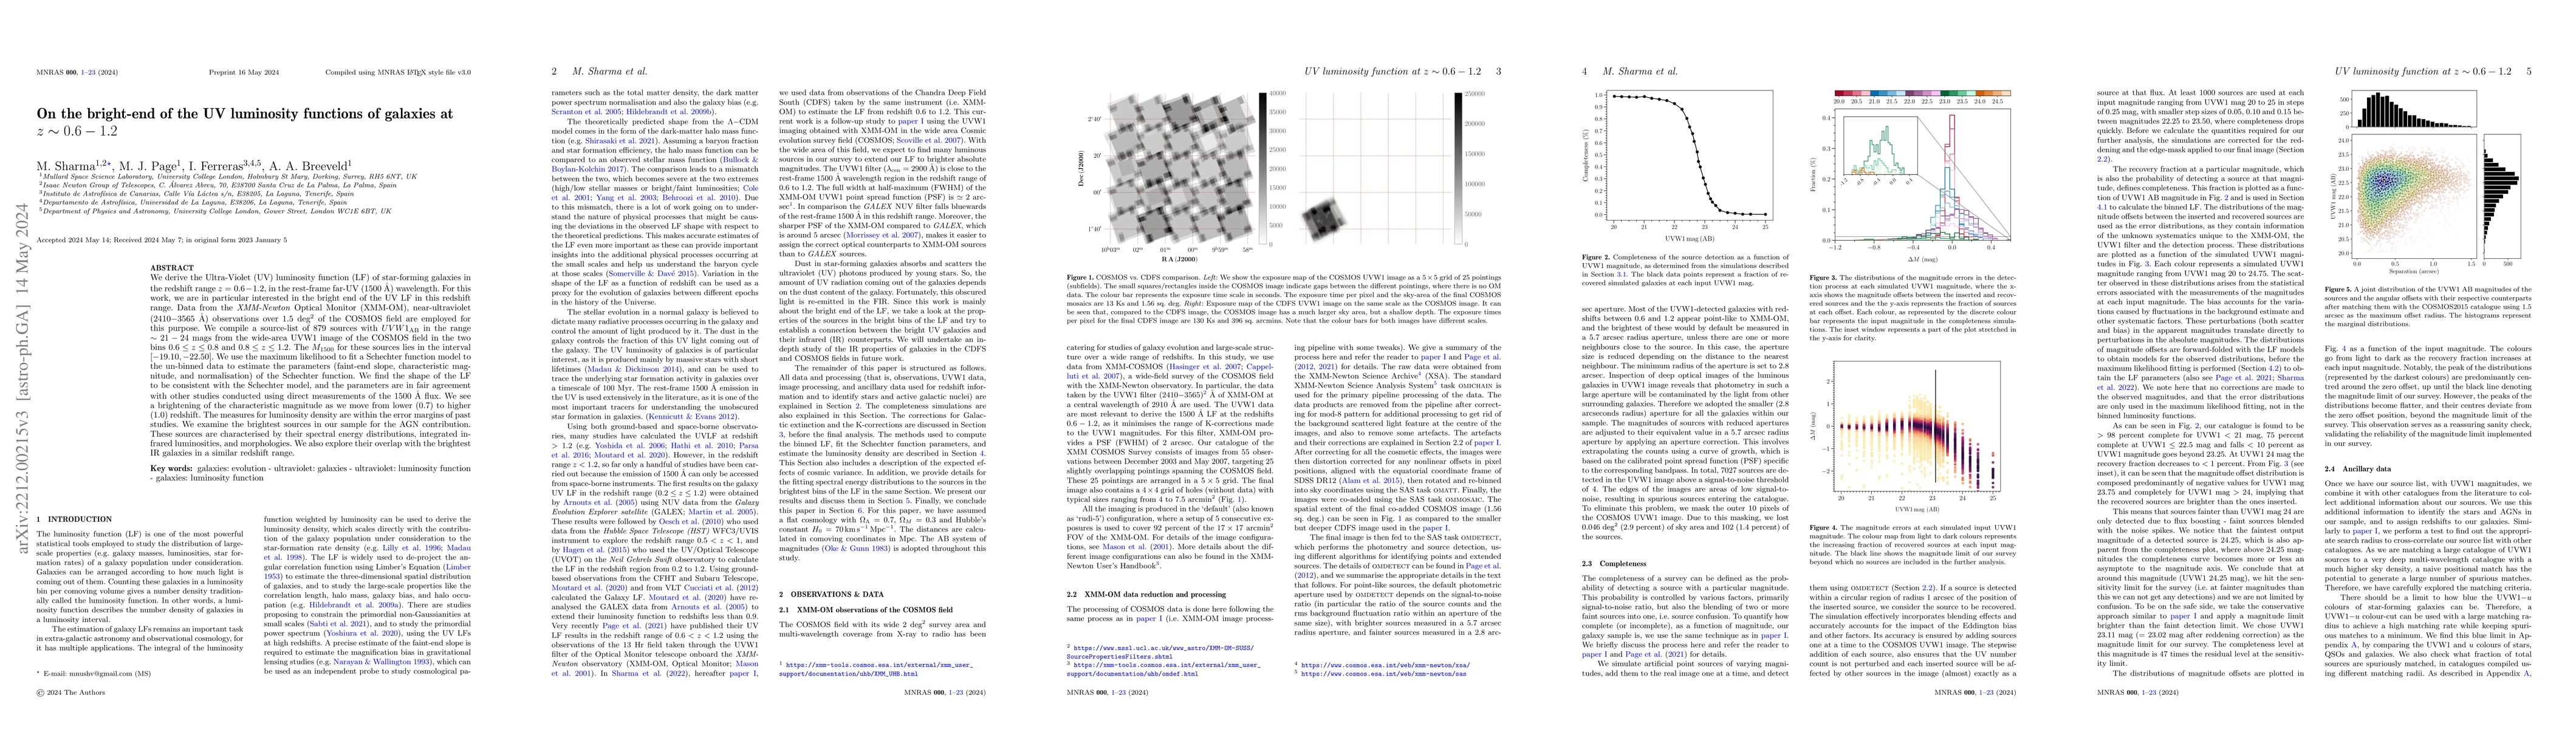
We derive the Ultra-Violet (UV) luminosity function (LF) of star-forming galaxies in the redshift range $z = 0.6 - 1.2$, in the rest-frame far-UV ($1500$ \r{A}) wavelength. For this work, we are in particular interested in the bright end of the UV LF in this redshift range. Data from the XMM-Newton Optical Monitor (XMM-OM), near-ultraviolet ($2410-3565$ \r{A}) observations over 1.5 sq. deg of the COSMOS field are employed for this purpose. We compile a source-list of $879$ sources with $UVW1_\mathrm{AB}$ in the range $\sim 21-24$ mags from the wide-area UVW1 image of the COSMOS field in the two bins $0.6 \leq z \leq 0.8$ and $0.8 \leq z \leq 1.2$. The $M_{1500}$ for these sources lies in the interval $[-19.10,-22.50]$. We use the maximum likelihood to fit a Schechter function model to the un-binned data to estimate the parameters (faint-end slope, characteristic magnitude, and normalisation) of the Schechter function. We find the shape of the LF to be consistent with the Schechter model, and the parameters are in fair agreement with other studies conducted using direct measurements of the $1500$\r{A} flux. We see a brightening of the characteristic magnitude as we move from lower ($0.7$) to higher ($1.0$) redshift. The measures for luminosity density are within the error margins of past studies. We examine the brightest sources in our sample for the AGN contribution. These sources are characterised by their spectral energy distributions, integrated infrared luminosities, and morphologies. We also explore their overlap with the brightest IR galaxies in a similar redshift range.
AI Key Findings
Get AI-generated insights about this paper's methodology, results, and significance.
Paper Details
PDF Preview
Key Terms
Citation Network
Current paper (gray), citations (green), references (blue)
Display is limited for performance on very large graphs.
Similar Papers
Found 4 papersOn the Dust properties of the UV galaxies in the redshift range $z \sim 0.6-1.2$
M. Sharma, I. Ferreras, M. J. Page et al.
The UV luminosity functions of Bright z>8 Galaxies: Determination from ~0.41 deg2 of HST Observations along ~sim 300 independent sightlines
Guido Roberts-Borsani, Tommaso Treu, Takahiro Morishita et al.
| Title | Authors | Year | Actions |
|---|
Comments (0)