Summary
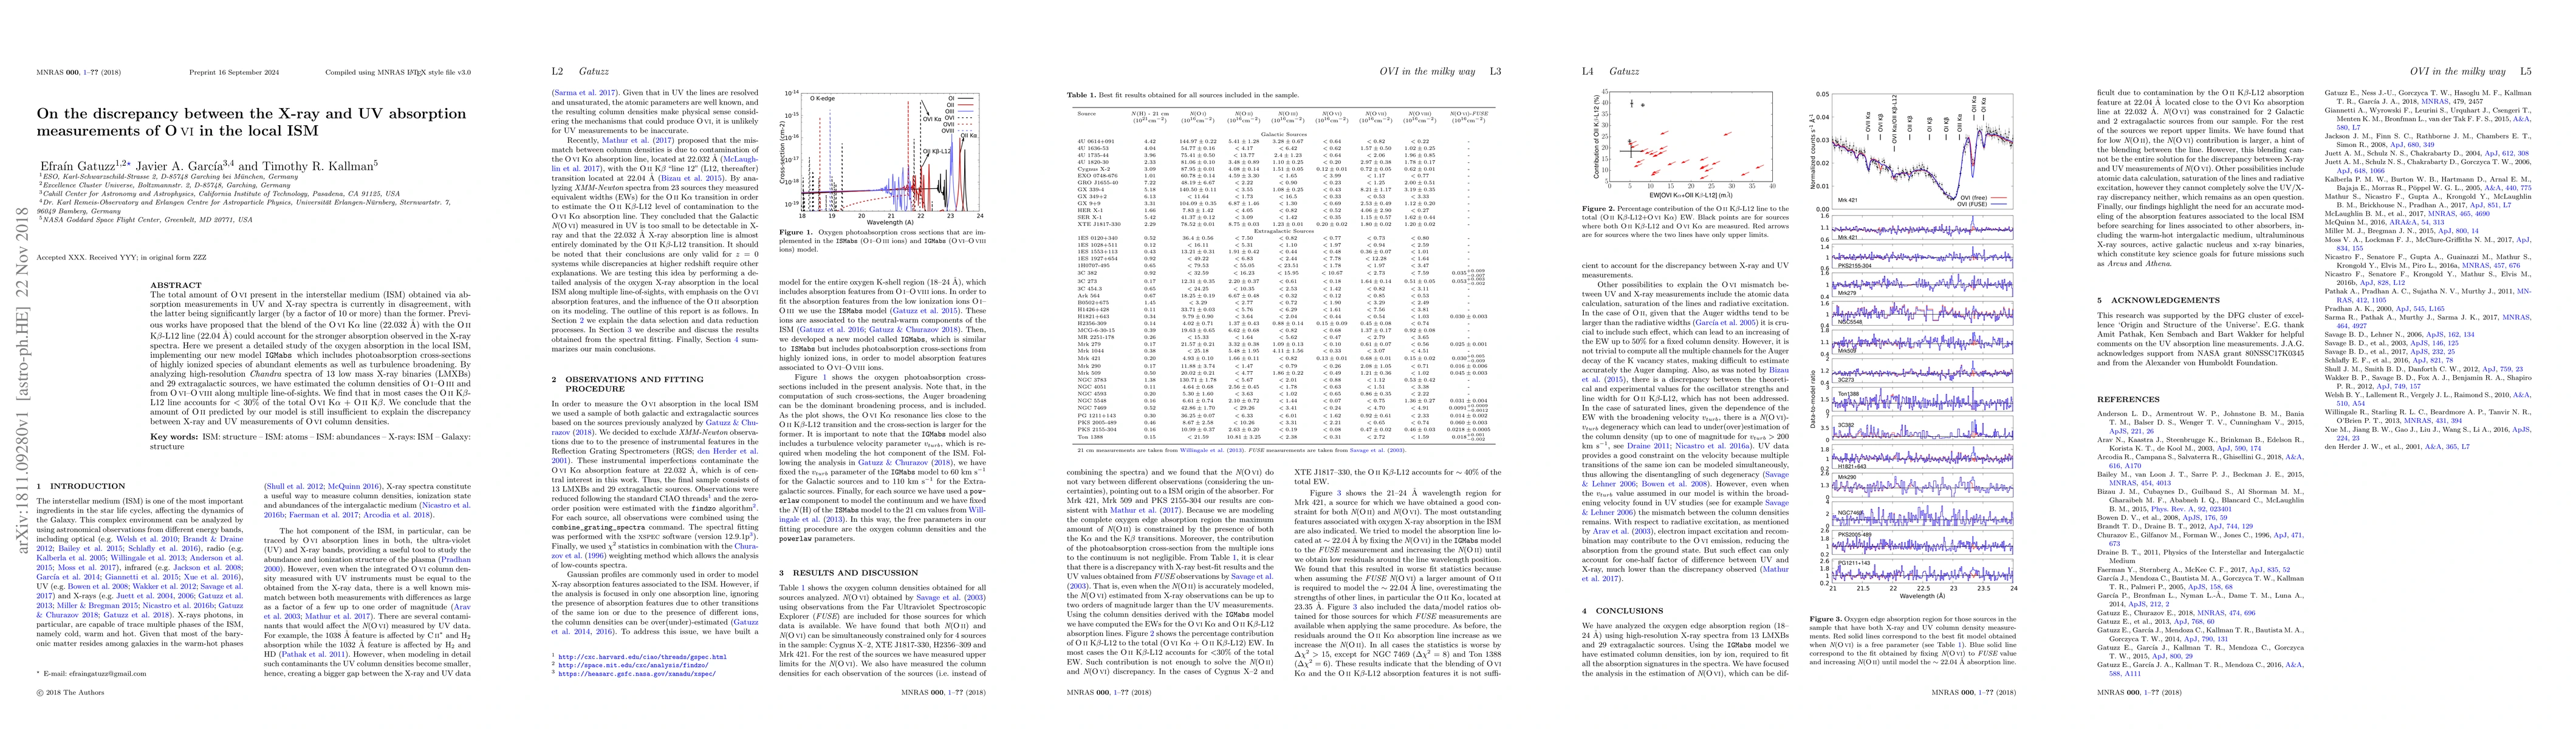
The total amount of OVI present in the interstellar medium (ISM) obtained via absorption measurements in UV and X-ray spectra is currently in disagreement, with the latter being significantly larger (by a factor of 10 or more) than the former. Previous works have proposed that the blend of the OVI Ka line (22.032 A) with the OII Kb-L12 line (22.04 A) could account for the stronger absorption observed in the X-ray spectra. Here we present a detailed study of the oxygen absorption in the local ISM, implementing our new model IGMabs, which includes photoabsorption cross-sections of highly ionized species of abundant elements as well as turbulence broadening. By analyzing high-resolution Chandra spectra of 13 low mass X-ray binaries (LMXBs) and 29 extragalactic sources, we have estimated the column densities of OI-OIII and from OVI-OVIII along multiple line-of-sights. We find that in most cases the OII Kb-L12 line accounts for < 30% of the total OVI Ka + OII Kb. We conclude that the amount of OII predicted by our model is still insufficient to explain the discrepancy between X-ray and UV measurements of OVI column densities.
AI Key Findings
Get AI-generated insights about this paper's methodology, results, and significance.
Paper Details
PDF Preview
Key Terms
Citation Network
Current paper (gray), citations (green), references (blue)
Display is limited for performance on very large graphs.
Similar Papers
Found 4 papersSulfur X-ray absorption in the local ISM
Javier A. García, Efrain Gatuzz, Timothy R. Kallman et al.
Argon X-ray absorption in the local ISM
J. A. García, E. Gatuzz, T. W. Gorczyca et al.
| Title | Authors | Year | Actions |
|---|
Comments (0)