On the dynamic behavior of the network SIR epidemic model
Publication
Metrics
AI Quick Summary
This paper explores the dynamic behavior of an SIR epidemic model across a network of interacting subpopulations, revealing that unlike the classical SIR model, network models can exhibit multimodal infection curves. It focuses on rank-1 interaction matrices, finding $n$ invariants and conditions for stability, and showing that nodes may have infection curves with multiple peaks.
Paper Preview
Abstract
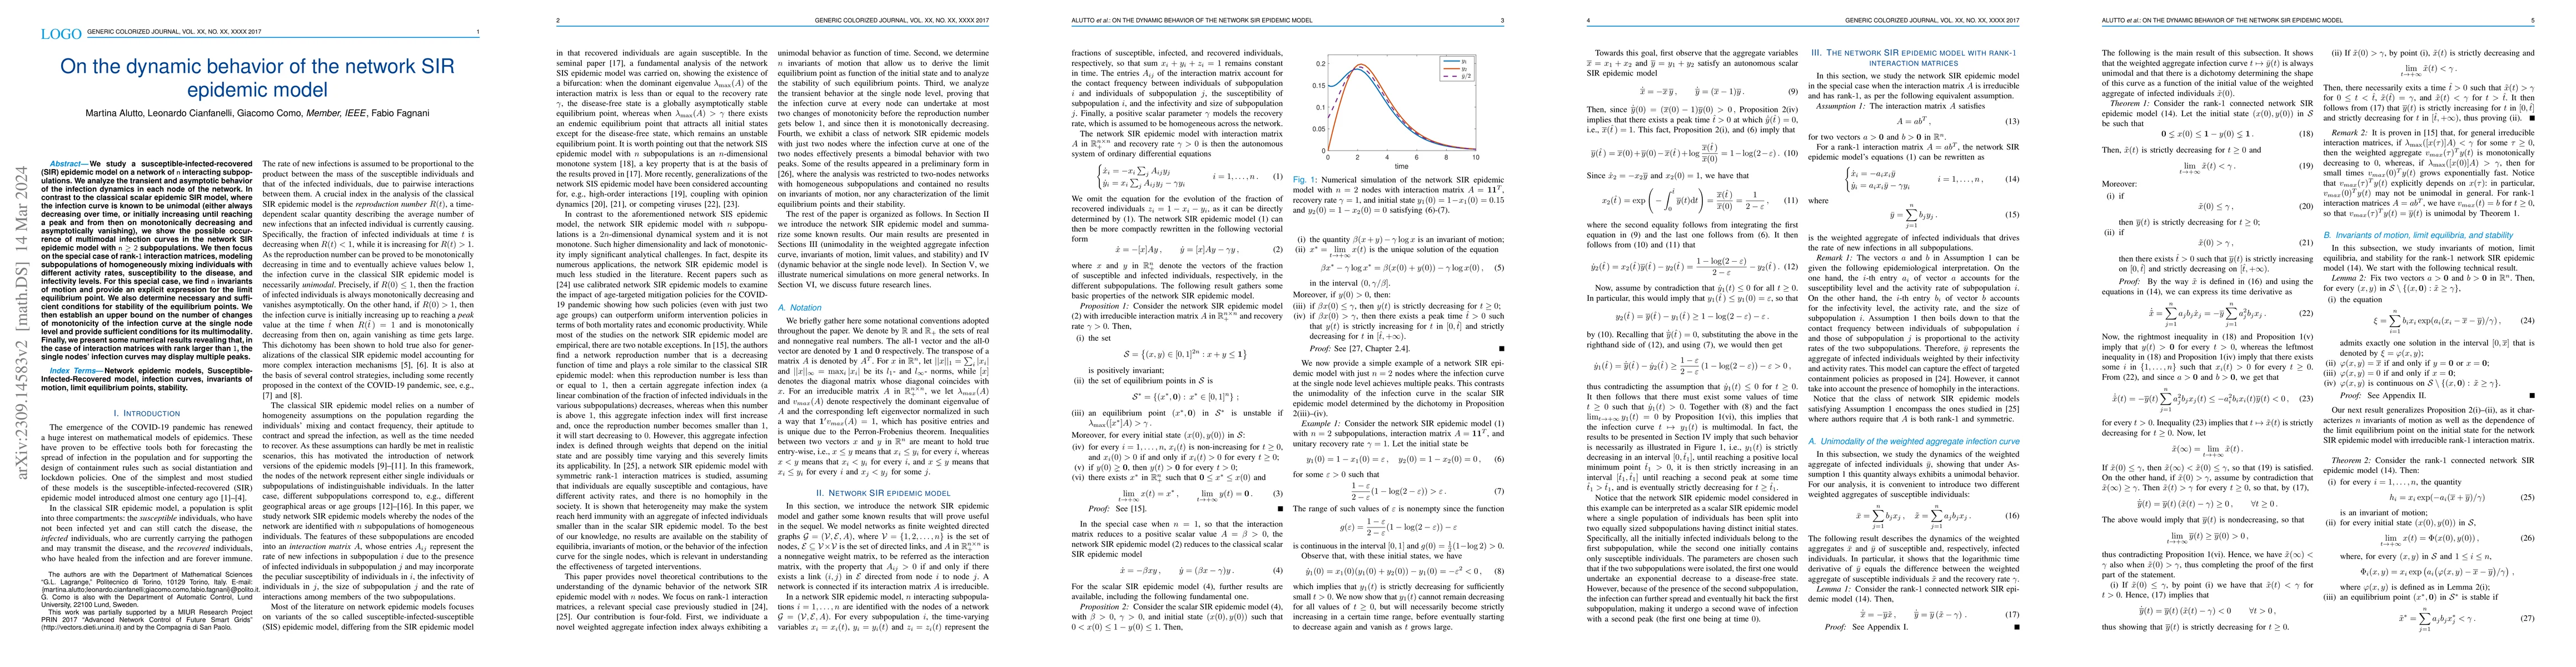
We study a susceptible-infected-recovered (SIR) epidemic model on a network of $n$ interacting subpopulations. We analyze the transient and asymptotic behavior of the infection dynamics in each node of the network. In contrast to the classical scalar epidemic SIR model, where the infection curve is known to be unimodal (either always decreasing over time, or initially increasing until reaching a peak and from then on monotonically decreasing and asymptotically vanishing), we show the possible occurrence of multimodal infection curves in the network SIR epidemic model with $n\ge2$ subpopulations. We then focus on the special case of rank-$1$ interaction matrices, modeling subpopulations of homogeneously mixing individuals with different activity rates, susceptibility to the disease, and infectivity levels. For this special case, we find $n$ invariants of motion and provide an explicit expression for the limit equilibrium point. We also determine necessary and sufficient conditions for stability of the equilibrium points. We then establish an upper bound on the number of changes of monotonicity of the infection curve at the single node level and provide sufficient conditions for its multimodality. Finally, we present some numerical results revealing that, in the case of interaction matrices with rank larger than $1$, the single nodes' infection curves may display multiple peaks.
AI Key Findings
Get AI-generated insights about this paper's methodology, results, significance, and more — seven facets brought into focus.
Impact
Paper Details
Authors
PDF Preview
Key Terms
Citation Network
Current paper (gray), citations (green), references (blue)
Display is limited for performance on very large graphs.
Discussion 0