Summary
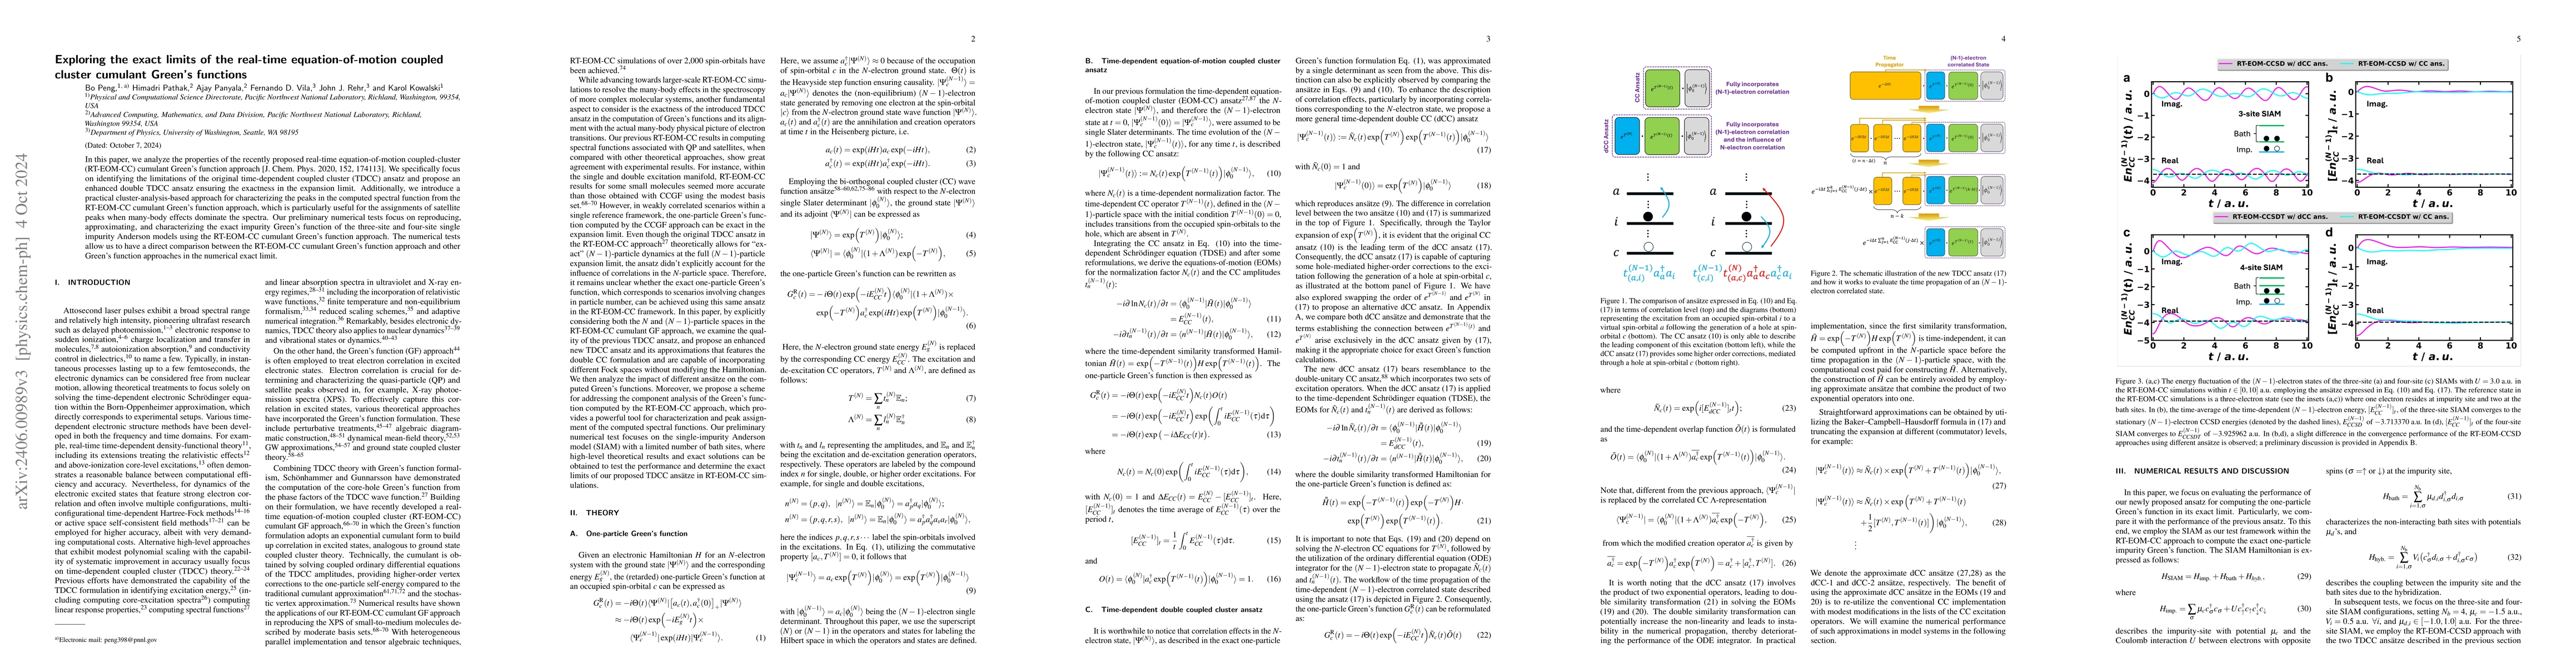
In this paper, we analyze the properties of the recently proposed real-time equation-of-motion coupled-cluster (RT-EOM-CC) cumulant Green's function approach [J. Chem. Phys. 2020, 152, 174113]. We specifically focus on identifying the limitations of the original time-dependent coupled cluster (TDCC) ansatz and propose an enhanced extended TDCC ansatz ensuring the exactness in the expansion limit. Additionally, we introduce a practical cluster-analysis-based approach for characterizing the peaks in the computed spectral function from the RT-EOM-CC cumulant Green's function approach, which is particularly useful for the assignments of satellite peaks when many-body effects dominate the spectra. Our preliminary numerical tests focus on reproducing, approximating, and characterizing the exact impurity Green's function of the three-site and four-site single impurity Anderson models using the RT-EOM-CC cumulant Green's function approach. The numerical tests allow us to have a direct comparison between the RT-EOM-CC cumulant Green's function approach and other Green's function approaches in the numerical exact limit.
AI Key Findings
Get AI-generated insights about this paper's methodology, results, and significance.
Paper Details
PDF Preview
Key Terms
Citation Network
Current paper (gray), citations (green), references (blue)
Display is limited for performance on very large graphs.
Similar Papers
Found 4 papersReal-time Equation-of-Motion Coupled-Cluster Cumulant Green's Function Method: Heterogeneous Parallel Implementation Based on the Tensor Algebra for Many-body Methods Infrastructure
Bo Peng, Karol Kowalski, John J. Rehr et al.
The time-dependent bivariational principle: Theoretical foundation for real-time propagation methods of coupled-cluster type
Thomas Bondo Pedersen, Simen Kvaal, Mads Greisen Højlund et al.
Approximate Exponential Integrators for Time-Dependent Equation-of-Motion Coupled Cluster Theory
Chao Yang, A. Eugene DePrince III, David B. Williams-Young et al.
No citations found for this paper.
Comments (0)