Summary
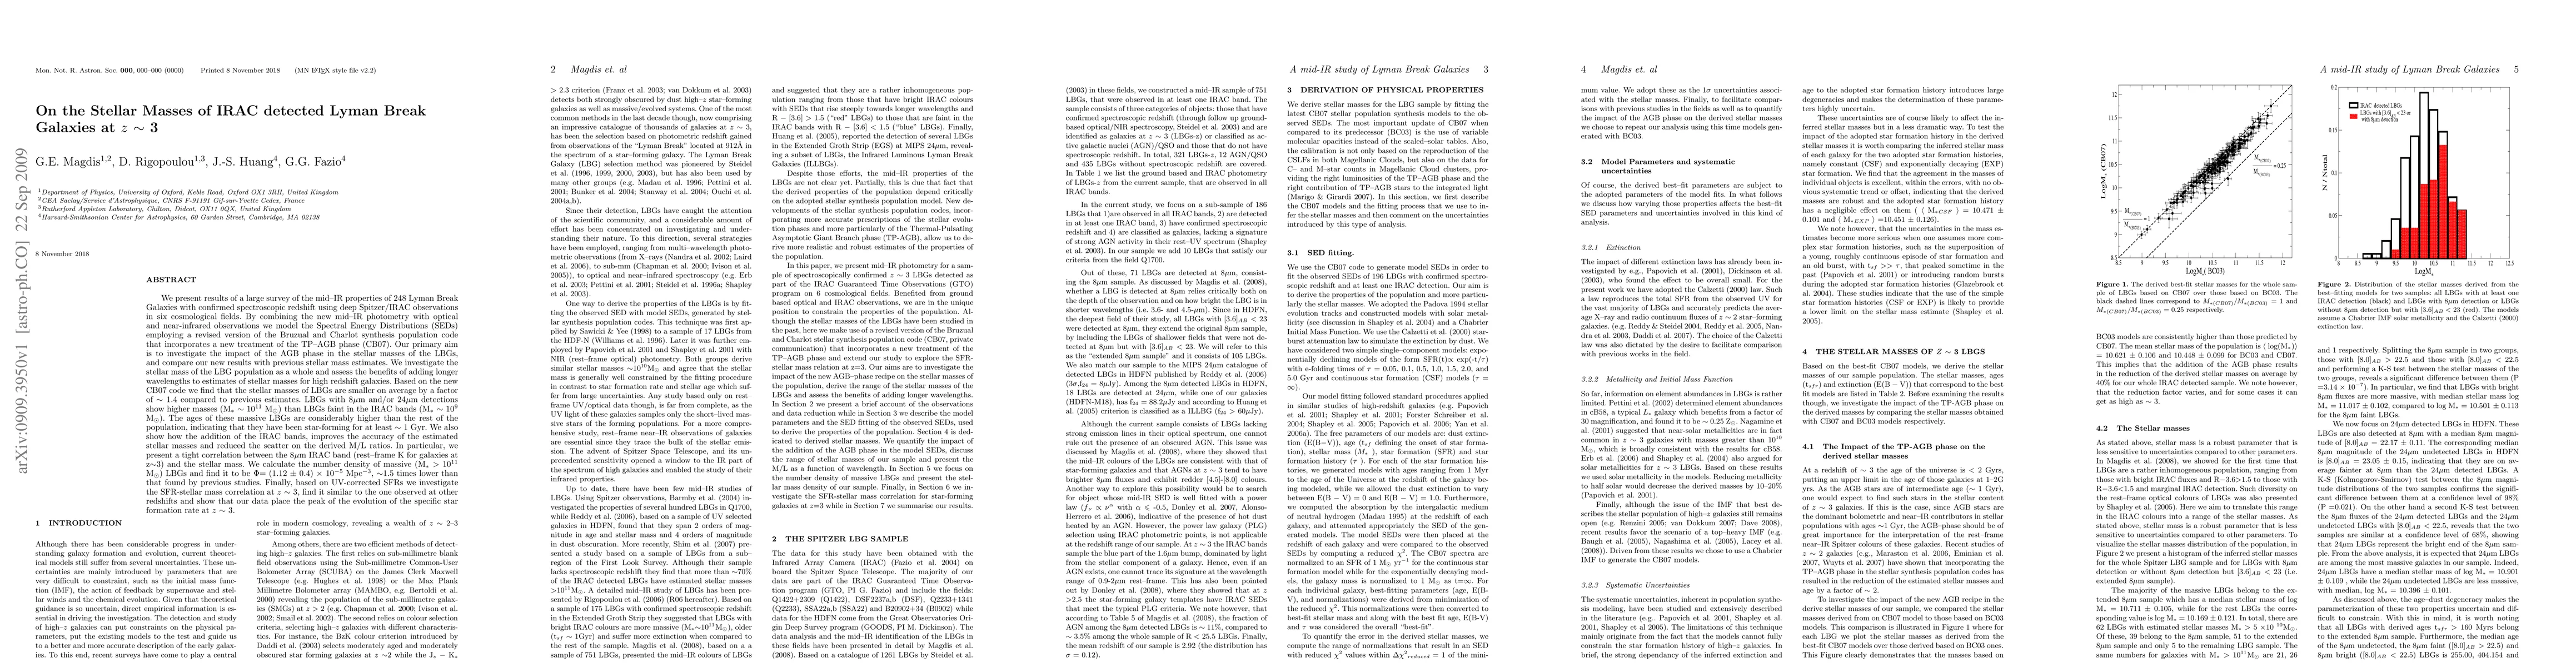
We present results of a large survey of the mid--IR properties of 248 Lyman Break Galaxies with confirmed spectroscopic redshift using deep Spitzer/IRAC observations in six cosmological fields. We model the Spectral Energy Distributions (SEDs) employing a revised version of the Bruzual and Charlot synthesis population code that incorporates a new treatment of the TP--AGB phase (CB07). Our primary aim is to investigate the impact of the AGB phase in the stellar masses of the LBGs, and compare our new results with previous stellar mass estimates. Based on the new CB07 code we find that the stellar masses of LBGs are smaller on average by a factor of ~1.4 compared to previous estimates. LBGs with 8um and/or 24um detections show higher masses (M~10^11 Mo) than LBGs faint in the IRAC bands (M~10^9 Mo). The ages of these massive LBGs are considerably higher than the rest of the population, indicating that they have been star-forming for at least ~1 Gyr. We also show how the addition of the IRAC bands, improves the accuracy of the estimated stellar masses and reduced the scatter on the derived M/L ratios. In particular, we present a tight correlation between the 8um IRAC band (rest-frame K for galaxies at z~3) and the stellar mass. We calculate the number density of massive (M > 10^11 Mo) LBGs and find it to be $\Phi$= (1.12 $\pm$ 0.4) x 10^(-5) Mpc^(-3), ~1.5 times lower than that found by previous studies. Finally, based on UV-corrected SFRs we investigate the SFR-stellar mass correlation at z~3, find it similar to the one observed at other redshifts and show that our data place the peak of the evolution of the specific star formation rate at z~3.
AI Key Findings
Get AI-generated insights about this paper's methodology, results, and significance.
Paper Details
PDF Preview
Key Terms
Citation Network
Current paper (gray), citations (green), references (blue)
Display is limited for performance on very large graphs.
Similar Papers
Found 4 papers| Title | Authors | Year | Actions |
|---|
Comments (0)