Publication
Metrics
AI Quick Summary
Researchers develop a new method to visualize and verify ternary probabilistic forecasts using geometric interpretations of triangles, providing a clearer understanding of forecast accuracy and reliability.
Paper Preview
Abstract
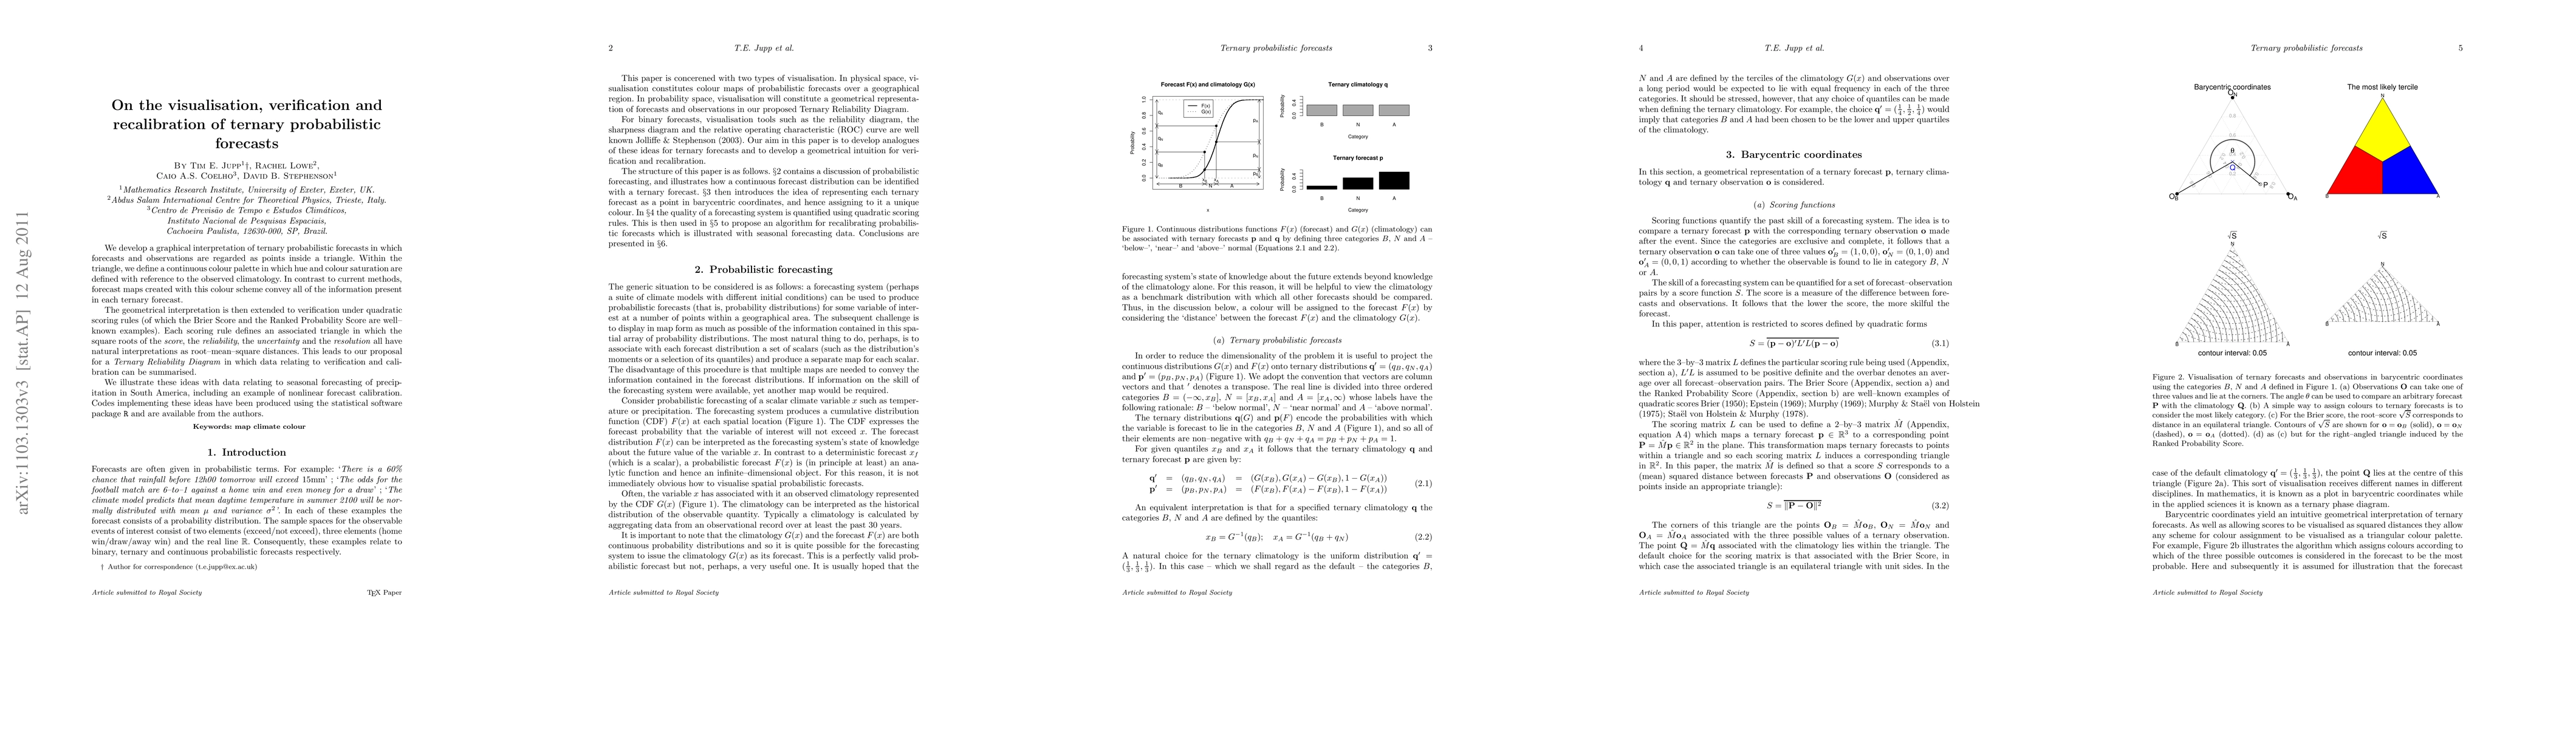
We develop a geometrical interpretation of ternary probabilistic forecasts in which forecasts and observations are regarded as points inside a triangle. Within the triangle, we define a continuous colour palette in which hue and colour saturation are defined with reference to the observed climatology. In contrast to current methods, forecast maps created with this colour scheme convey all of the information present in each ternary forecast. The geometrical interpretation is then extended to verification under quadratic scoring rules (of which the Brier Score and the Ranked Probability Score are well--known examples). Each scoring rule defines an associated triangle in which the square roots of the score, the reliability, the uncertainty and the resolution all have natural interpretations as root--mean--square distances. This leads to our proposal for a Ternary Reliability Diagram in which data relating to verification and calibration can be summarised. We illustrate these ideas with data relating to seasonal forecasting of precipitation in South America, including an example of nonlinear forecast calibration. Codes implementing these ideas have been produced using the statistical software package R and are available from the authors.
AI Key Findings
Get AI-generated insights about this paper's methodology, results, significance, and more — seven facets brought into focus.
Impact
Paper Details
PDF Preview
Key Terms
Citation Network
Current paper (gray), citations (green), references (blue)
Display is limited for performance on very large graphs.
Discussion 0