One Explanation is Not Enough: Structured Attention Graphs for Image Classification
Publication
Metrics
AI Quick Summary
Researchers introduce Structured Attention Graphs (SAGs) to explain image classification decisions, showing they improve accuracy in answering counterfactual questions.
Paper Preview
Abstract
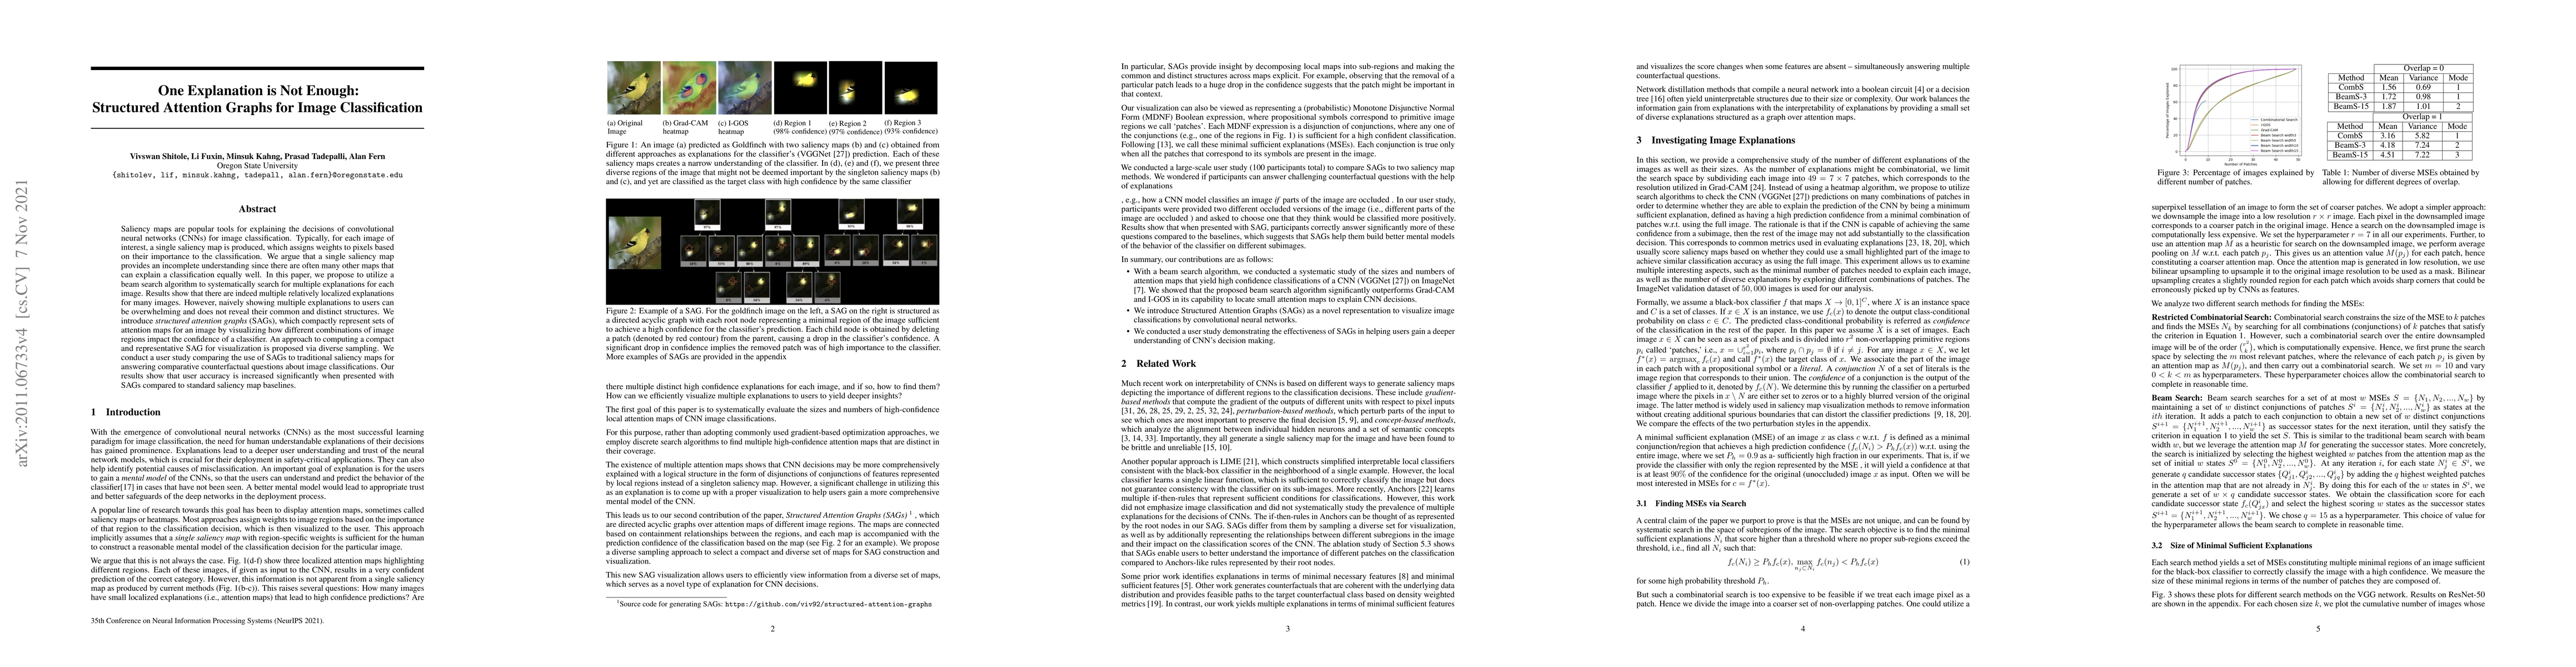
Attention maps are a popular way of explaining the decisions of convolutional networks for image classification. Typically, for each image of interest, a single attention map is produced, which assigns weights to pixels based on their importance to the classification. A single attention map, however, provides an incomplete understanding since there are often many other maps that explain a classification equally well. In this paper, we introduce structured attention graphs (SAGs), which compactly represent sets of attention maps for an image by capturing how different combinations of image regions impact a classifier's confidence. We propose an approach to compute SAGs and a visualization for SAGs so that deeper insight can be gained into a classifier's decisions. We conduct a user study comparing the use of SAGs to traditional attention maps for answering counterfactual questions about image classifications. Our results show that the users are more correct when answering comparative counterfactual questions based on SAGs compared to the baselines.
AI Key Findings
Get AI-generated insights about this paper's methodology, results, significance, and more — seven facets brought into focus.
Impact
Paper Details
Authors
PDF Preview
Key Terms
Citation Network
Current paper (gray), citations (green), references (blue)
Display is limited for performance on very large graphs.
Discussion 0