01
MethodologyHow they did it
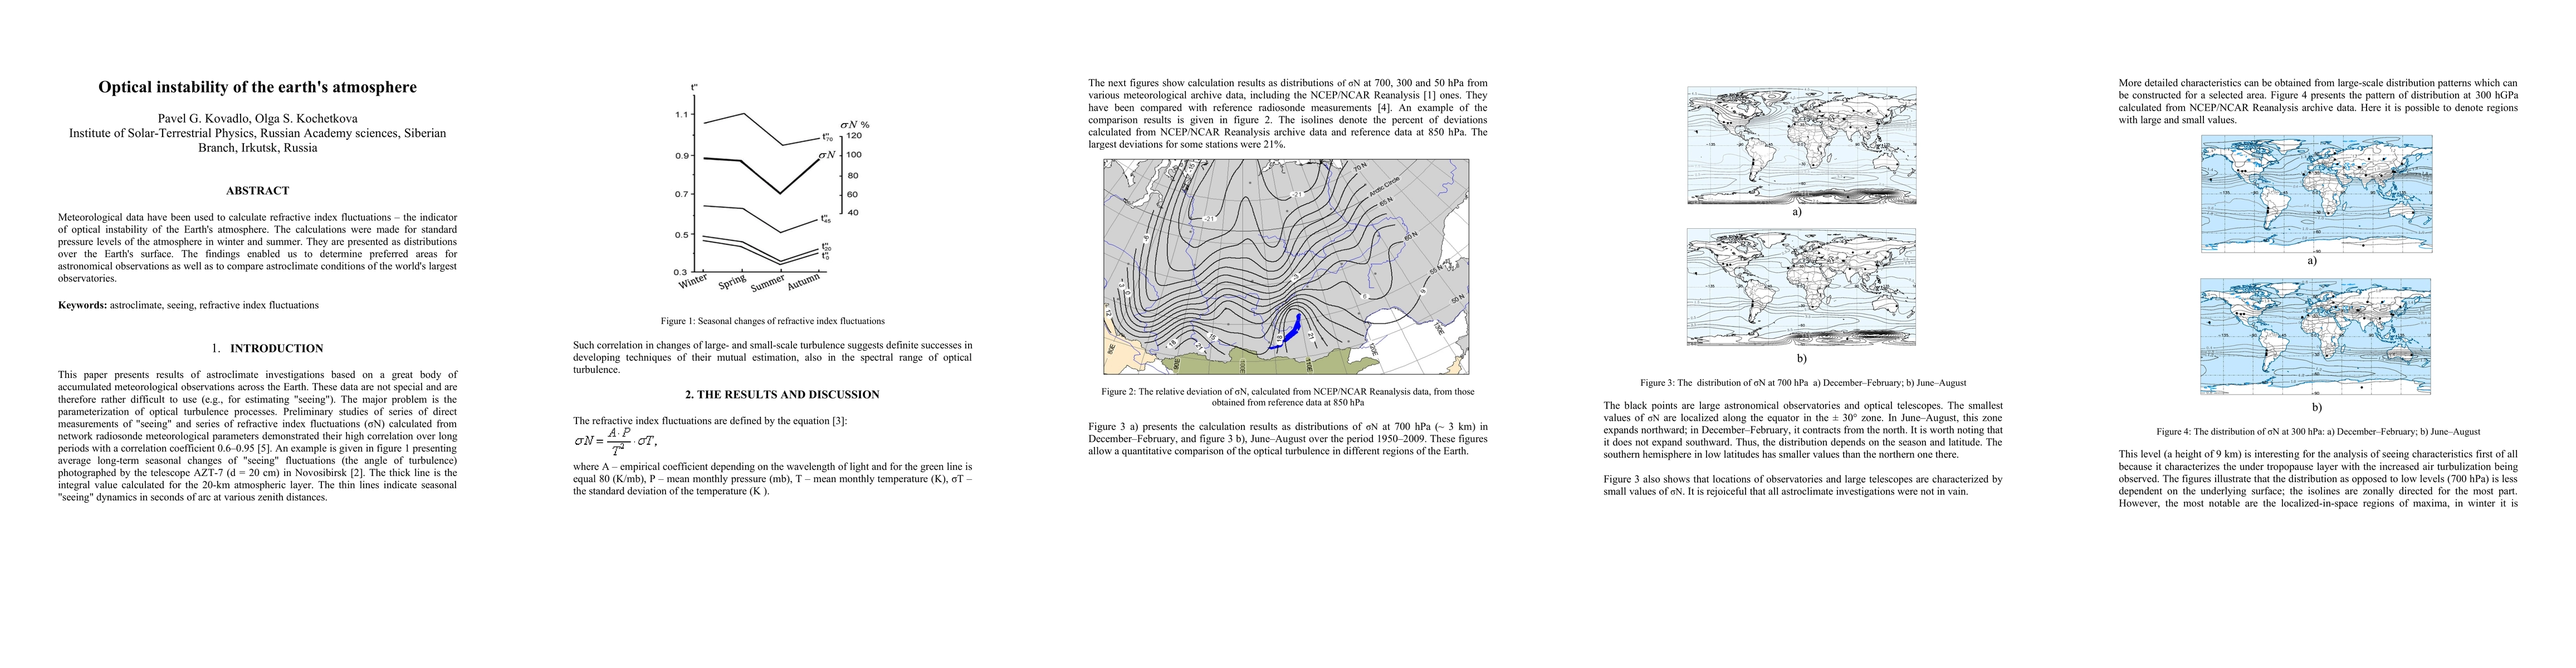
The research utilized meteorological data to calculate refractive index fluctuations, an indicator of optical instability in the Earth's atmosphere, for standard pressure levels in both winter and summer. These calculations were presented as distributions over the Earth's surface.
Discussion 0