Publication
Metrics
AI Quick Summary
This study analyzes the optical variability power spectrum densities of 14 blazars, revealing that 19 out of 29 monitoring sessions show PSDs fitting simple power-laws with slopes ranging from 1.4 to 4.0, indicating diverse stochastic processes. The average PSD slope of 2.9±0.3 is steeper than red noise, suggesting a cutoff in variability around a few days.
Paper Preview
Abstract
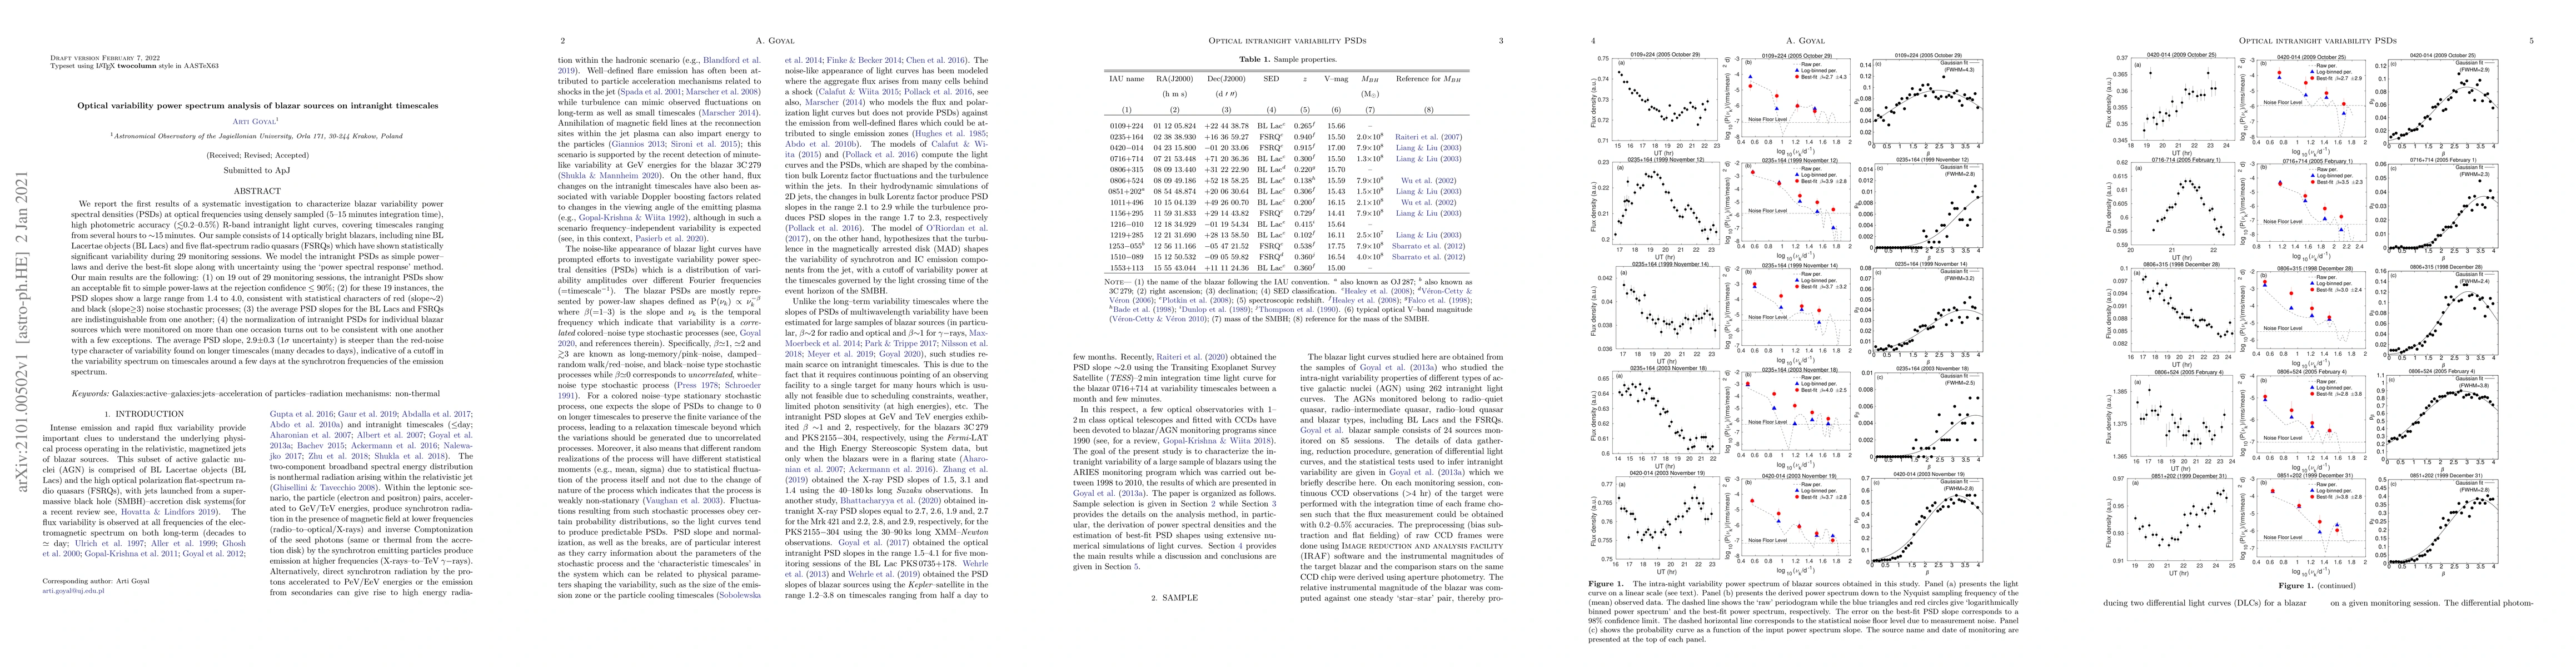
We report the first results of a systematic investigation to characterize blazar variability power spectral densities (PSDs) at optical frequencies using densely sampled (5--15 minutes integration time), high photometric accuracy ($\lesssim$0.2--0.5\%) R-band intranight light curves, covering timescales ranging from several hours to $\sim$15\,minutes. Our sample consists of 14 optically bright blazars, including nine BL Lacertae objects (BL Lacs) and five flat-spectrum radio quasars (FSRQs) which have shown statistically significant variability during 29 monitoring sessions. We model the intranight PSDs as simple power--laws and derive the best-fit slope along with uncertainty using the `power spectral response' method. Our main results are the following: (1) on 19 out of 29 monitoring sessions, the intranight PSDs show an acceptable fit to simple power-laws at the rejection confidence $\leq$ 90\%; (2) for these 19 instances, the PSD slopes show a large range from 1.4 to 4.0, consistent with statistical characters of red (slope$\sim$2) and black (slope$\geq$3) noise stochastic processes; (3) the average PSD slopes for the BL Lacs and FSRQs are indistinguishable from one another; (4) the normalization of intranight PSDs for individual blazar sources which were monitored on more than one occasion turns out to be consistent with one another with a few exceptions. The average PSD slope, 2.9$\pm$0.3 (1$\sigma$ uncertainty) is steeper than the red-noise type character of variability found on longer timescales (many decades to days), indicative of a cutoff in the variability spectrum on timescales around a few days at the synchrotron frequencies of the emission spectrum.
AI Key Findings
Get AI-generated insights about this paper's methodology, results, significance, and more — seven facets brought into focus.
Impact
Paper Details
Authors
PDF Preview
Key Terms
Citation Network
Current paper (gray), citations (green), references (blue)
Display is limited for performance on very large graphs.
Discussion 0