Optimal Algorithms for Augmented Testing of Discrete Distributions
Publication
Metrics
AI Quick Summary
This paper develops optimal algorithms for testing properties of discrete distributions, leveraging a predictor to reduce sample complexity. The algorithms adapt their sample requirements based on the predictor's accuracy, maintaining both consistency and robustness, and achieving information-theoretically optimal sample reductions, validated by experimental success on real data.
Paper Preview
Abstract
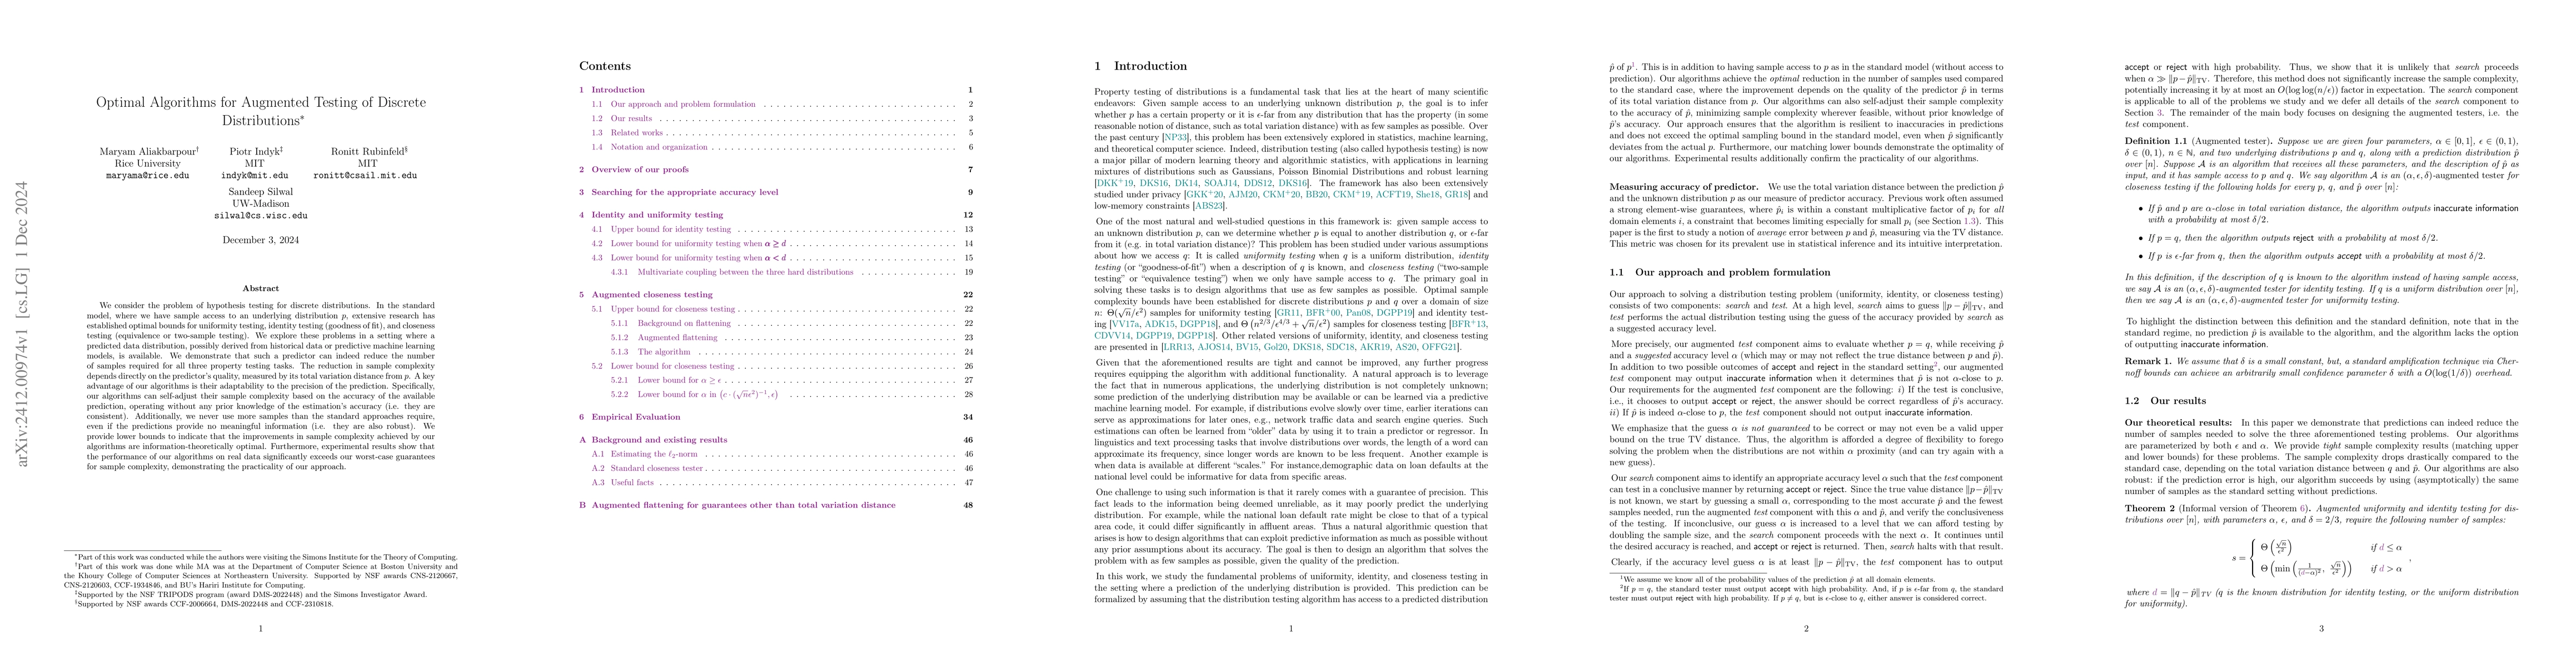
We consider the problem of hypothesis testing for discrete distributions. In the standard model, where we have sample access to an underlying distribution $p$, extensive research has established optimal bounds for uniformity testing, identity testing (goodness of fit), and closeness testing (equivalence or two-sample testing). We explore these problems in a setting where a predicted data distribution, possibly derived from historical data or predictive machine learning models, is available. We demonstrate that such a predictor can indeed reduce the number of samples required for all three property testing tasks. The reduction in sample complexity depends directly on the predictor's quality, measured by its total variation distance from $p$. A key advantage of our algorithms is their adaptability to the precision of the prediction. Specifically, our algorithms can self-adjust their sample complexity based on the accuracy of the available prediction, operating without any prior knowledge of the estimation's accuracy (i.e. they are consistent). Additionally, we never use more samples than the standard approaches require, even if the predictions provide no meaningful information (i.e. they are also robust). We provide lower bounds to indicate that the improvements in sample complexity achieved by our algorithms are information-theoretically optimal. Furthermore, experimental results show that the performance of our algorithms on real data significantly exceeds our worst-case guarantees for sample complexity, demonstrating the practicality of our approach.
AI Key Findings
Get AI-generated insights about this paper's methodology, results, significance, and more — seven facets brought into focus.
Impact
Paper Details
Authors
PDF Preview
Citation Network
Current paper (gray), citations (green), references (blue)
Display is limited for performance on very large graphs.
Discussion 0