Optimal Spectral Sensitivity of Multispectral Filter Array for Pathological Images
Publication
Metrics
AI Quick Summary
This paper proposes a pathology-specific multispectral filter array (MSFA) to optimize spectral sensitivity for capturing pathological images, aiming to reduce capturing time and cost. The method iteratively optimizes filter array sensitivities to minimize reconstruction error, demonstrating improved performance compared to conventional methods.
Paper Preview
Abstract
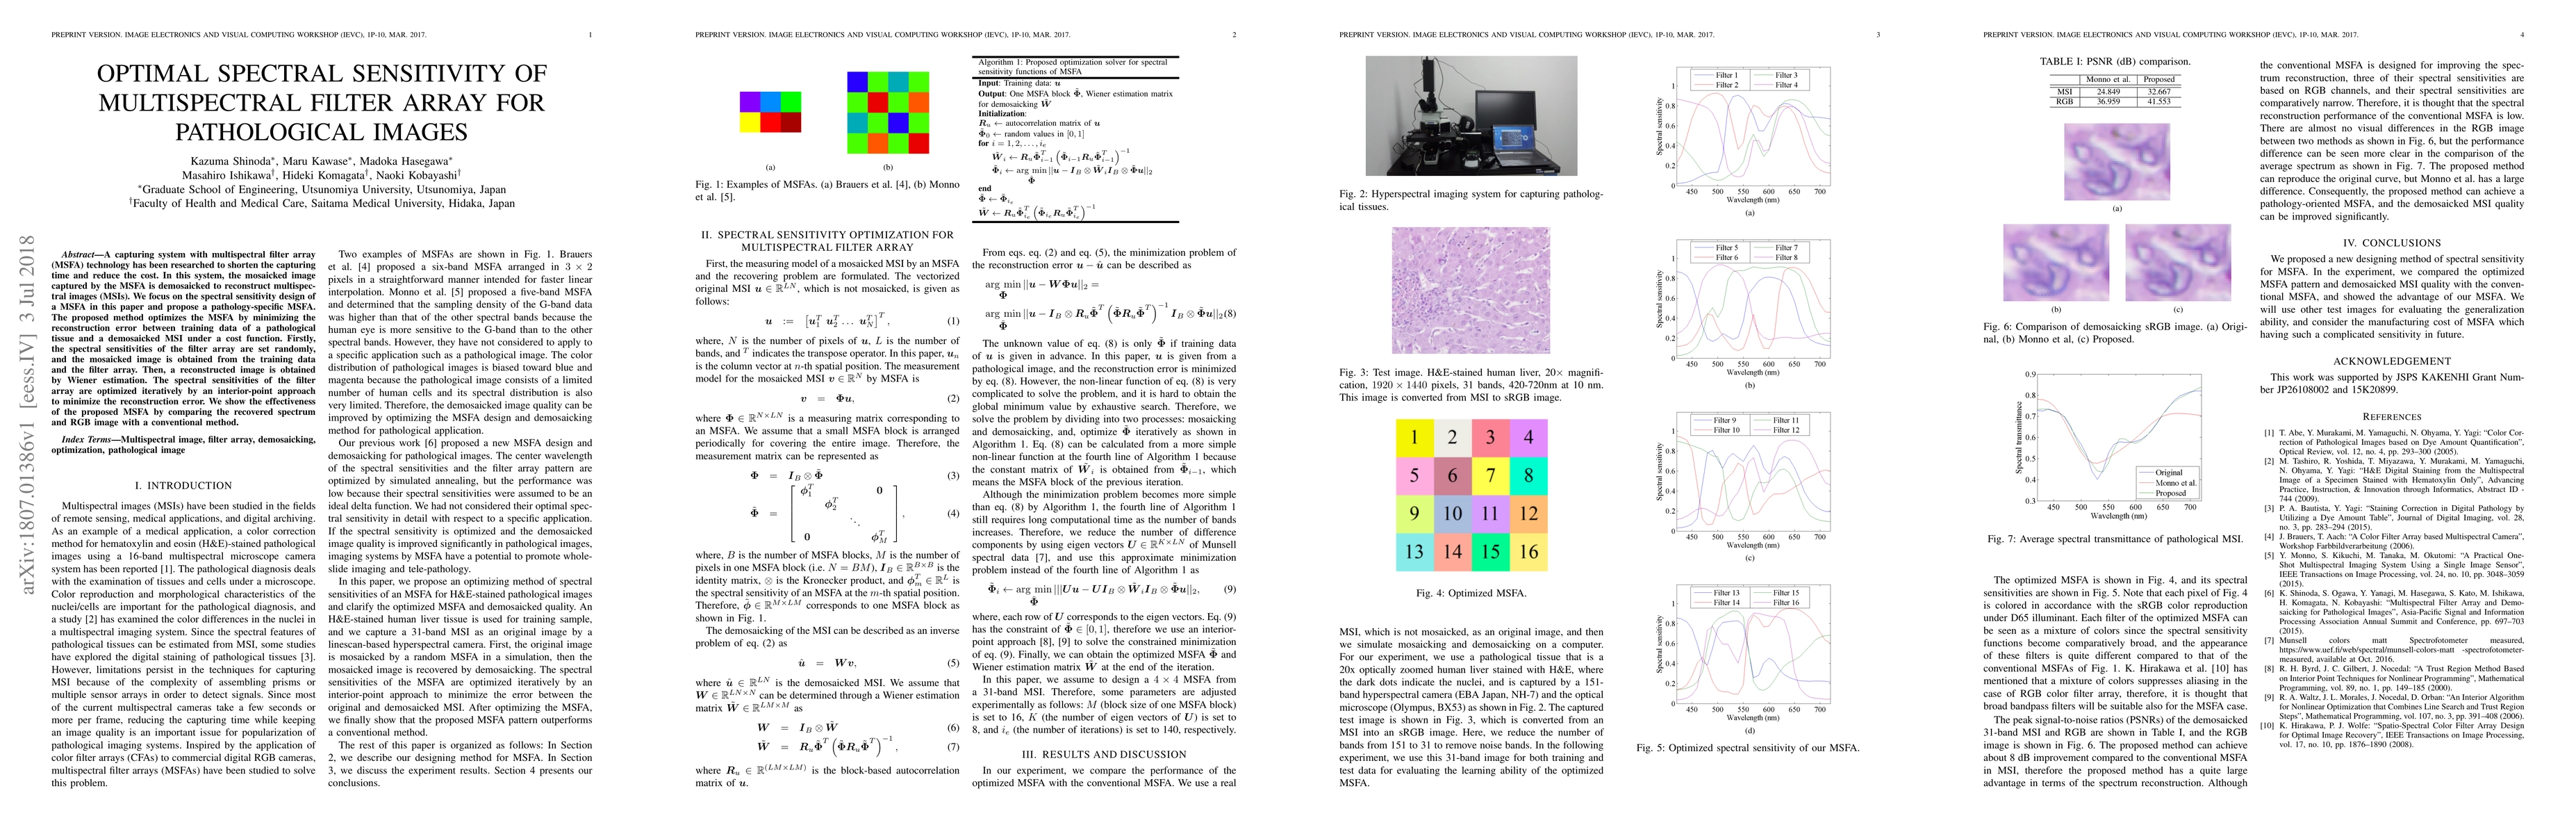
A capturing system with multispectral filter array (MSFA) technology has been researched to shorten the capturing time and reduce the cost. In this system, the mosaicked image captured by the MSFA is demosaicked to reconstruct multispectral images (MSIs). We focus on the spectral sensitivity design of a MSFA in this paper and propose a pathology-specific MSFA. The proposed method optimizes the MSFA by minimizing the reconstruction error between training data of a pathological tissue and a demosaicked MSI under a cost function. Firstly, the spectral sensitivities of the filter array are set randomly, and the mosaicked image is obtained from the training data and the filter array. Then, a reconstructed image is obtained by Wiener estimation. The spectral sensitivities of the filter array are optimized iteratively by an interior-point approach to minimize the reconstruction error. We show the effectiveness of the proposed MSFA by comparing the recovered spectrum and RGB image with a conventional method.
AI Key Findings
Get AI-generated insights about this paper's methodology, results, significance, and more — seven facets brought into focus.
Impact
Paper Details
PDF Preview
Key Terms
Citation Network
Current paper (gray), citations (green), references (blue)
Display is limited for performance on very large graphs.
Discussion 0