Background
Influence diagrams (IDs) are a graphical formalism for sequential decision making under uncertainty, combining a qualitative structure (variables and dependencies) with a quantitative parametric layer (conditional probabilities and utilities). When only rough estimates are available for probabilities and preferences, standard solution techniques struggle or require strong simplifying assumptions. This motivates qualitative approaches that can reason with imprecision while still leveraging the graphical structure of IDs.
The authors build on Wilson’s qualitative decision theory, which uses an order-of-magnitude calculus to represent probabilistic and utilitarian information. Rather than relying on precise numbers, they map probabilities and utilities to a coarse scale governed by a small parameter /epsilon1, capturing the idea that some events are orders of magnitude more likely or valuable than others.
Problem / Research Question
The central question is how to model and solve sequential decision problems when quantitative parameters are imprecise or partially ordered. Specifically: (1) how to represent probabilities and utilities in a way that supports algebraic manipulation on imprecise values, (2) how to define a notion of optimality when there may be multiple, non-unique maxima, and (3) how to compute optimal decision policies efficiently under this qualitative regime.
Innovation / Contribution
The paper makes four core contributions:
- A formal order-of-magnitude framework (OOM-ID) that mirrors standard IDs but replaces numeric CPTs and utilities with order-of-magnitude representations. Probabilities map to O+; utilities to finite sets of order-of-magnitude values, capturing partial orderings.
- A robust algebra on sets of order-of-magnitude values, including addition, multiplication, and maximization, with a well-defined notion of equivalence (≈) and convex closure (≡). Theoretical results (Theorems 1–3) establish that finite sets can be efficiently represented (as either a singleton or a two-element set) and that distributivity properties hold under ≡ equivalence, enabling reliable computation.
- A specialized variable elimination algorithm, ELIM-OOM-ID, that extends Dechter’s bucket elimination to the order-of-magnitude setting. It computes probability components (λ) and utility components (θ) and eliminates variables via summation or maximization, producing an optimal policy set and the maximum order-of-magnitude expected utility.
- Empirical evaluation on randomly generated IDs transformed into OOM-IDs to assess fidelity. The results show that with moderate coarse representations (e.g., /epsilon1 = 0.5), the medians of relative error in policy value stay small, and the best policy is often indistinguishable from the exact solution; finer discretizations yield larger variability but still retain useful guidance as fidelity increases.
Methodology / Approach
The approach hinges on replacing precise CPTs and utilities with order-of-magnitude structures:
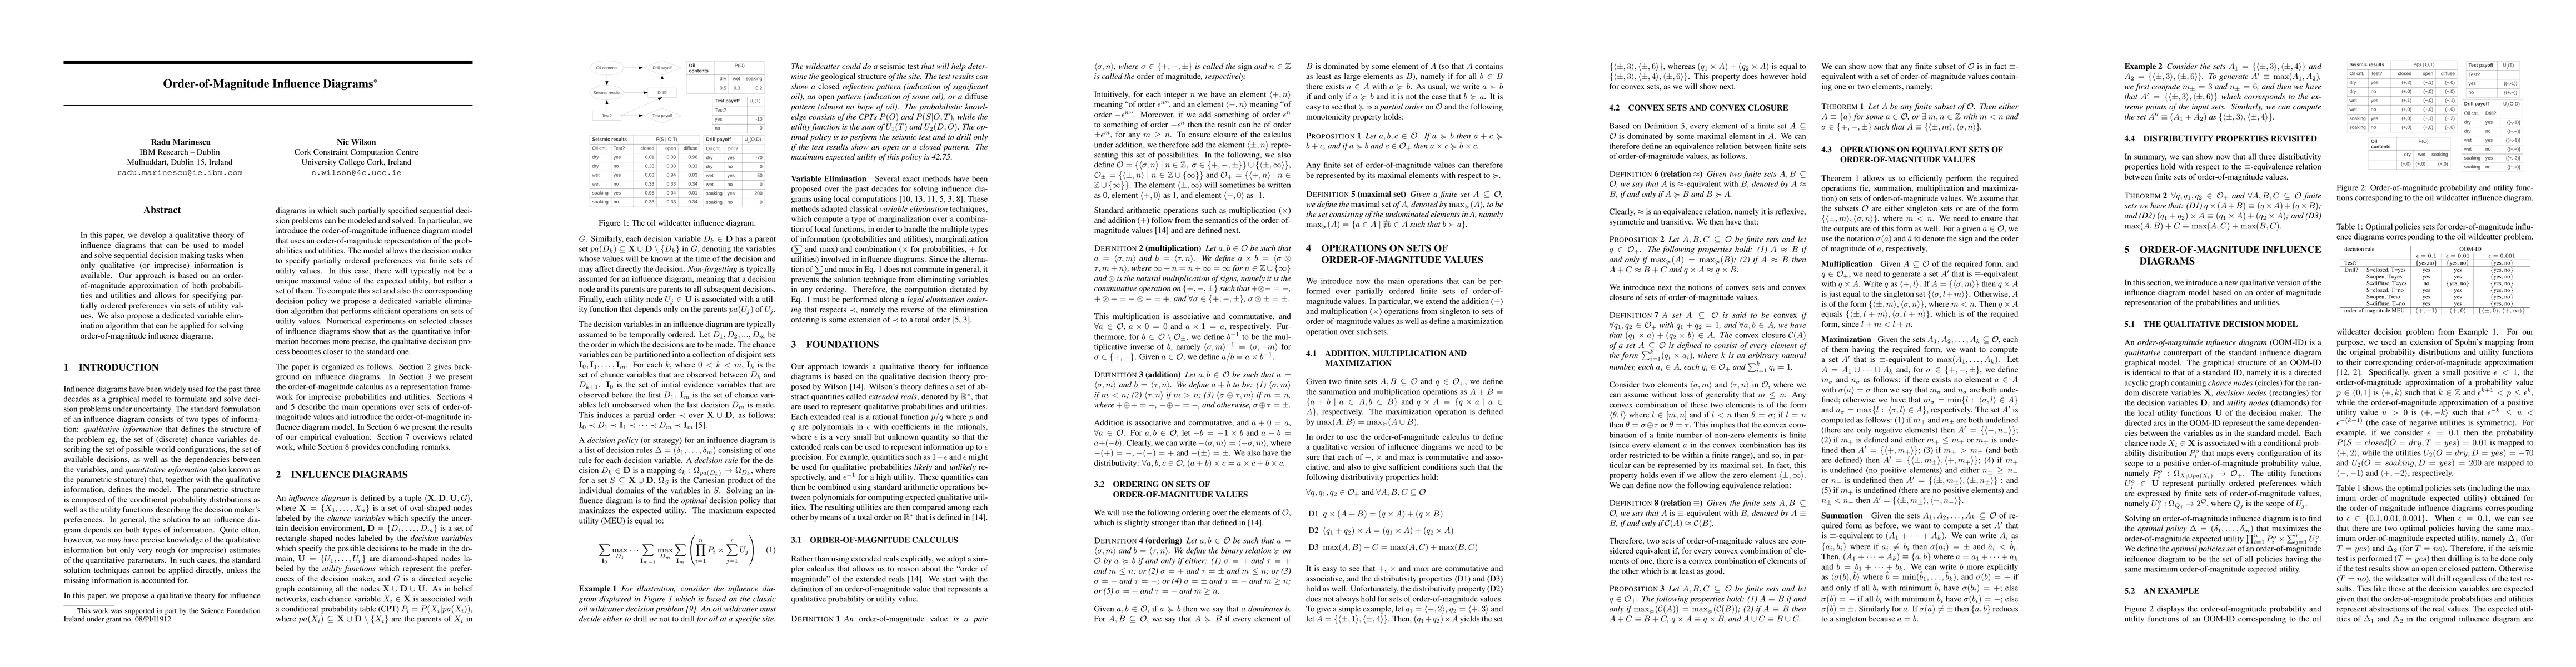
- Each chance node X_i has a CPT mapped to a positive order-of-magnitude value: P_o(i) : configurations → O+.
- Each utility node U_j has a finite set of order-of-magnitude values U_o(j): configurations → 2^O, expressing partially ordered preferences.
- Arithmetic is defined over O, with careful handling of signs and orders of magnitude. Sets of O-values are manipulated via addition, multiplication, and maximization, and their equivalence classes are used to keep representations compact (Theorems 1–2).
- The solution process mirrors standard IDs but operates on these qualitative objects. A legal elimination ordering is used; in the top-down phase, λ and θ components are computed for each bucket, then in the bottom-up phase, decision rules are extracted by maximizing over the bucket’s scope.
- Computational complexity is expressed as O(n · k^w*), where w* is the treewidth of the variable-elimination ordering and k bounds the variable domain size, guaranteeing tractable behavior for moderately structured diagrams.
Experiments / Evaluation
Two classes of random problems were generated to assess how well OOM-IDs approximate standard IDs:
- Class P: all utilities positive; Class M: mixed (positive and negative) utilities.
- The problems were transformed into OOM-IDs using the /epsilon1 mapping described in the paper, with epsilon values in {0.5, 0.05, 0.005}.
Performance measures compare the outcome in the standard ID against policies sampled from the OOM-ID’s optimal policy set. Two relative errors are used:
- η_med: the median-relative error of policy value over samples, relative to the true optimum.
- η_max: the relative error of the best policy among samples relative to the true optimum.
Key findings:
- For class P, η_med remains under 10% when /epsilon1 = 0.5; as the approximation becomes coarser (larger /epsilon1) or finer (smaller /epsilon1), η_med grows, reflecting information loss or dispersion in the policy set.
- Across all /epsilon1, the best policy derived from the OOM-ID (Δ_max) was essentially indistinguishable from the optimal policy of the exact ID (η_max ≈ 0).
- For class M (mixed utilities), the pattern is similar but with more pronounced variability: coarser approximations yield wider distributions of η_med and η_max due to the presence of multiple diverse near-optimal policies; the study also notes larger variance in expected utilities among sampled policies in these cases.
Key Results
The core technical results establish that:
- Any finite set of order-of-magnitude values has a concise ≈-equivalence representation, often reducible to one or two points (Theorem 1).
- The three distributivity properties hold under ≡ equivalence, ensuring stable algebra for A, B, C under +, ×, and max, which is essential for reliable ELIM-OOM-ID operations (Theorem 2).
- The ELIM-OOM-ID algorithm computes an optimal policy (or policy set) with a complexity bound tied to the treewidth of the elimination order, making it scalable for reasonably structured diagrams (Theorem 3).
Practical Applications
OOM-IDs are well suited for domains where decision making must proceed with qualitative or imprecise data, such as early-stage project planning, risk assessment under deep uncertainty, or strategic planning in environments with sparse or noisy data. The framework provides a principled way to reason about partial preferences and imprecise probabilities while preserving the familiar influence-diagram workflow. Practitioners can leverage the epsilon1 knob to trade computational tractability for decision fidelity, enabling robust planning when exact probabilities and utilities are unavailable or unreliable.
Limitations & Considerations
Several limitations and design choices merit careful consideration. First, while distributivity holds under the ≡ framework, D2 does not always hold for arbitrary sets, necessitating convex closure and equivalence-based representations that may increase abstraction in some cases. Second, the approach relies on a discretization via /epsilon1, and guidance on choosing appropriate values in new domains is not codified beyond empirical demonstrations. Third, the reported results are on randomly generated IDs mapped to OOM-IDs; real-world case studies with larger, more complex graphs remain to be validated. Finally, the computational cost depends on the treewidth of the elimination ordering, so very dense or highly interconnected problems may limit scalability without further architectural or algorithmic refinements.
Discussion 0