OrigamiPlot: An R Package and Shiny Web App Enhanced Visualizations for Multivariate Data
Publication
Metrics
AI Quick Summary
OrigamiPlot is an R package and Shiny web app that implements a novel origami plot technique for enhanced visualization of multivariate data, addressing radar chart limitations. It provides customizable features for improved clarity and is demonstrated effectively in network meta-analysis.
Paper Preview
Abstract
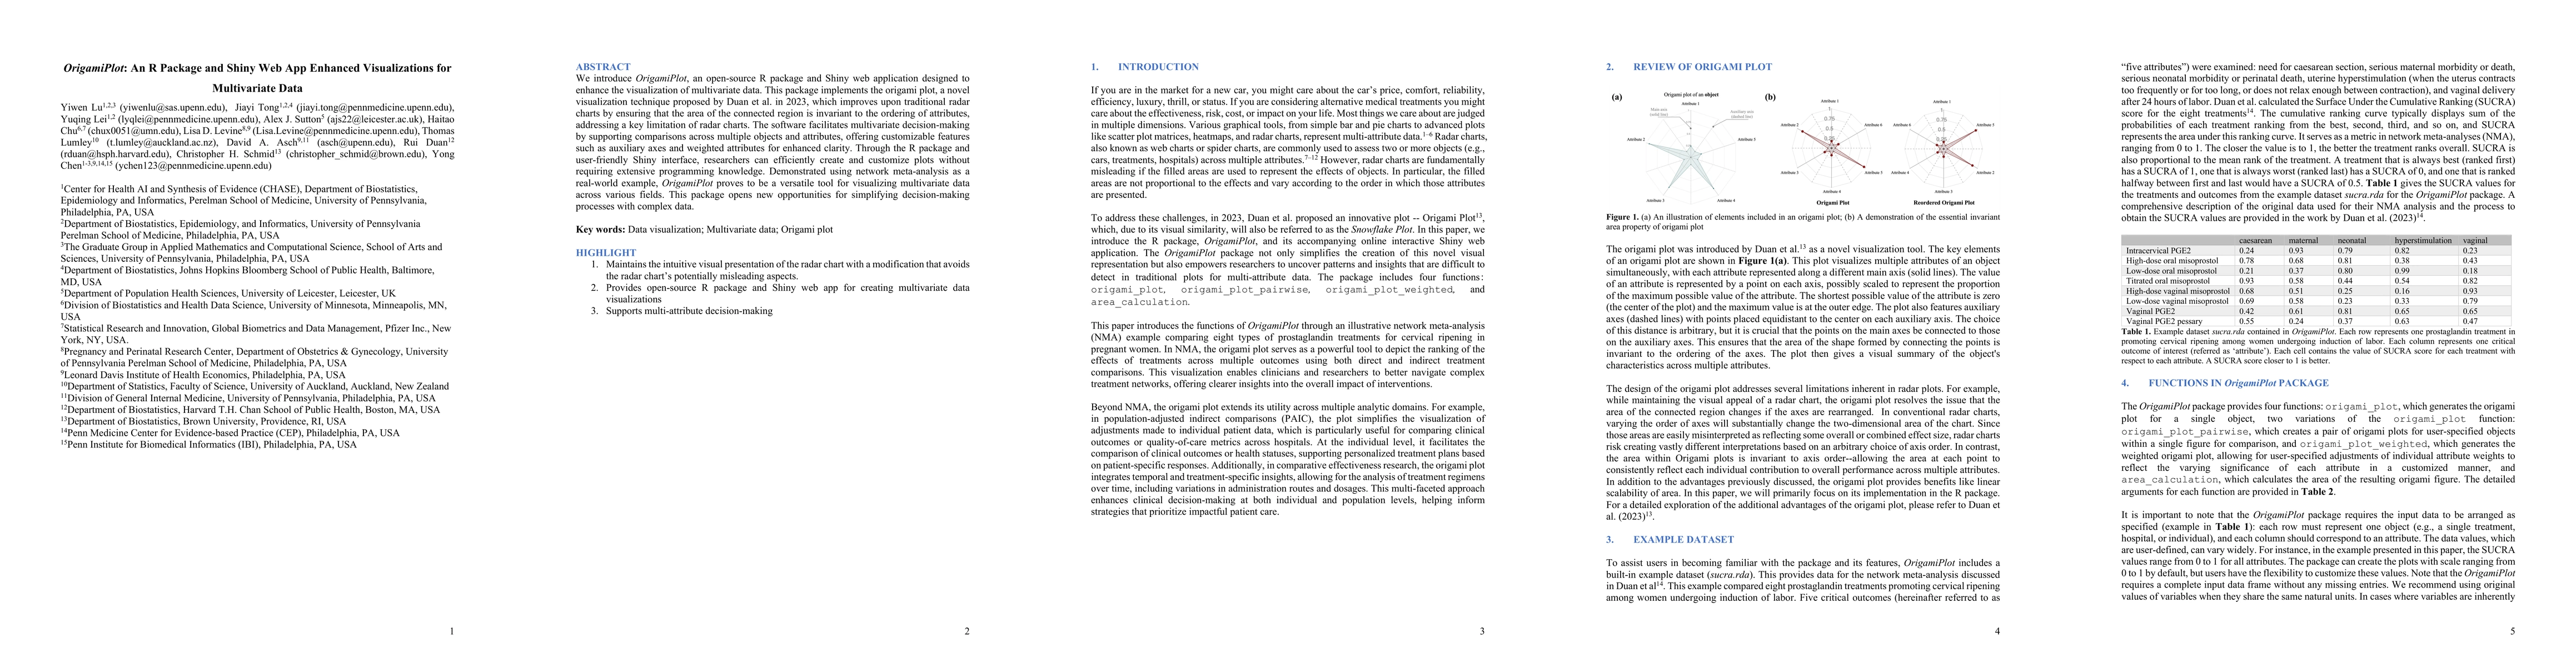
We introduce OrigamiPlot, an open-source R package and Shiny web application designed to enhance the visualization of multivariate data. This package implements the origami plot, a novel visualization technique proposed by Duan et al. in 2023, which improves upon traditional radar charts by ensuring that the area of the connected region is invariant to the ordering of attributes, addressing a key limitation of radar charts. The software facilitates multivariate decision-making by supporting comparisons across multiple objects and attributes, offering customizable features such as auxiliary axes and weighted attributes for enhanced clarity. Through the R package and user-friendly Shiny interface, researchers can efficiently create and customize plots without requiring extensive programming knowledge. Demonstrated using network meta-analysis as a real-world example, OrigamiPlot proves to be a versatile tool for visualizing multivariate data across various fields. This package opens new opportunities for simplifying decision-making processes with complex data.
AI Key Findings
Get AI-generated insights about this paper's methodology, results, significance, and more — seven facets brought into focus.
Authors
PDF Preview
Related Papers
No references found for this paper.
Discussion 0