Outage Performance Analysis of Full-Correlated Rayleigh MIMO Channels
Publication
Metrics
AI Quick Summary
This paper analyzes the outage performance of full-correlated Rayleigh MIMO channels, modeling spatial correlations using Kronecker correlation structure. It derives an analytical expression for outage probability, revealing insights into the impact of spatial correlation and providing design guidelines for MIMO configurations, validated by numerical experiments.
Paper Preview
Abstract
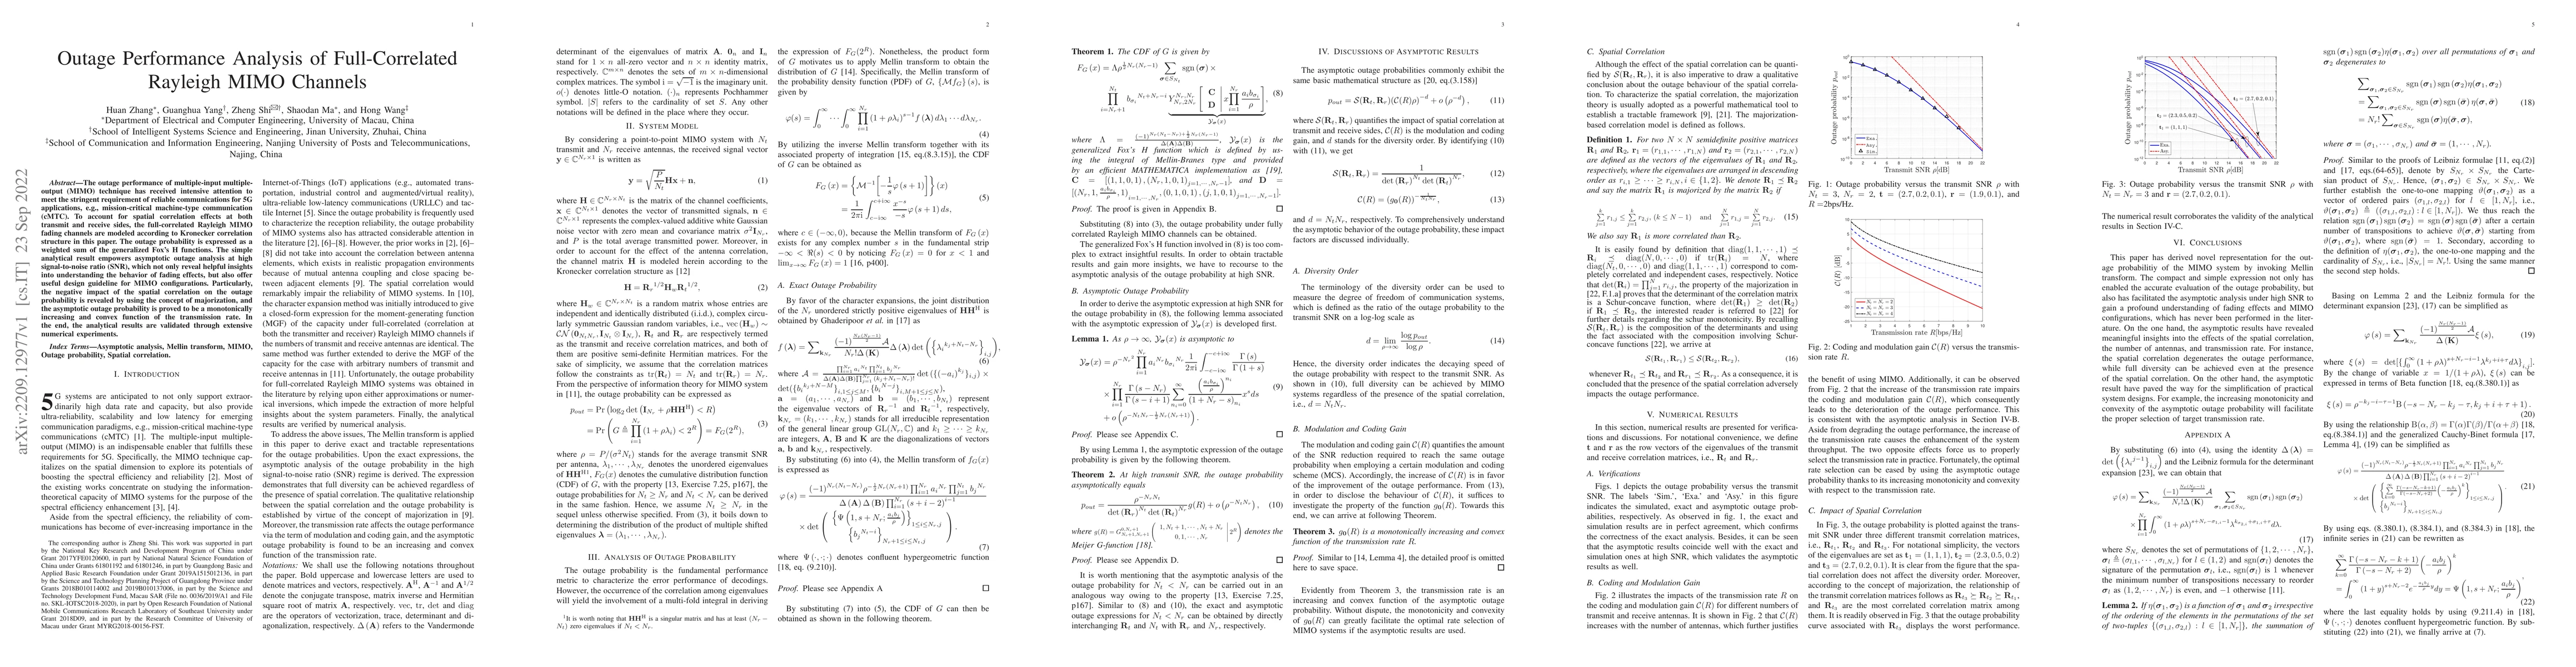
The outage performance of multiple-input multiple-output (MIMO) technique has received intensive attention to meet the stringent requirement of reliable communications for 5G applications, e.g., mission-critical machine-type communication (cMTC). To account for spatial correlation effects at both transmit and receive sides, the full-correlated Rayleigh MIMO fading channels are modeled according to Kronecker correlation structure in this paper. The outage probability is expressed as a weighted sum of the generalized Fox's H functions. The simple analytical result empowers asymptotic outage analysis at high signal-to-noise ratio (SNR), which not only reveal helpful insights into understanding the behavior of fading effects, but also offer useful design guideline for MIMO configurations. Particularly, the negative impact of the spatial correlation on the outage probability is revealed by using the concept of majorization, and the asymptotic outage probability is proved to be a monotonically increasing and convex function of the transmission rate. In the end, the analytical results are validated through extensive numerical experiments.
AI Key Findings
Get AI-generated insights about this paper's methodology, results, significance, and more — seven facets brought into focus.
Impact
Paper Details
Authors
PDF Preview
Key Terms
Citation Network
Current paper (gray), citations (green), references (blue)
Display is limited for performance on very large graphs.
Discussion 0