Publication
Metrics
AI Quick Summary
This paper surveys various outlier detection methods relevant to spatial analysis, emphasizing the importance of identifying and analyzing outliers in geospatial data, which can be crucial for applications like fraud detection and environmental monitoring. It highlights that while outliers may seem problematic, they can often provide valuable insights when examined separately.
Paper Preview
Abstract
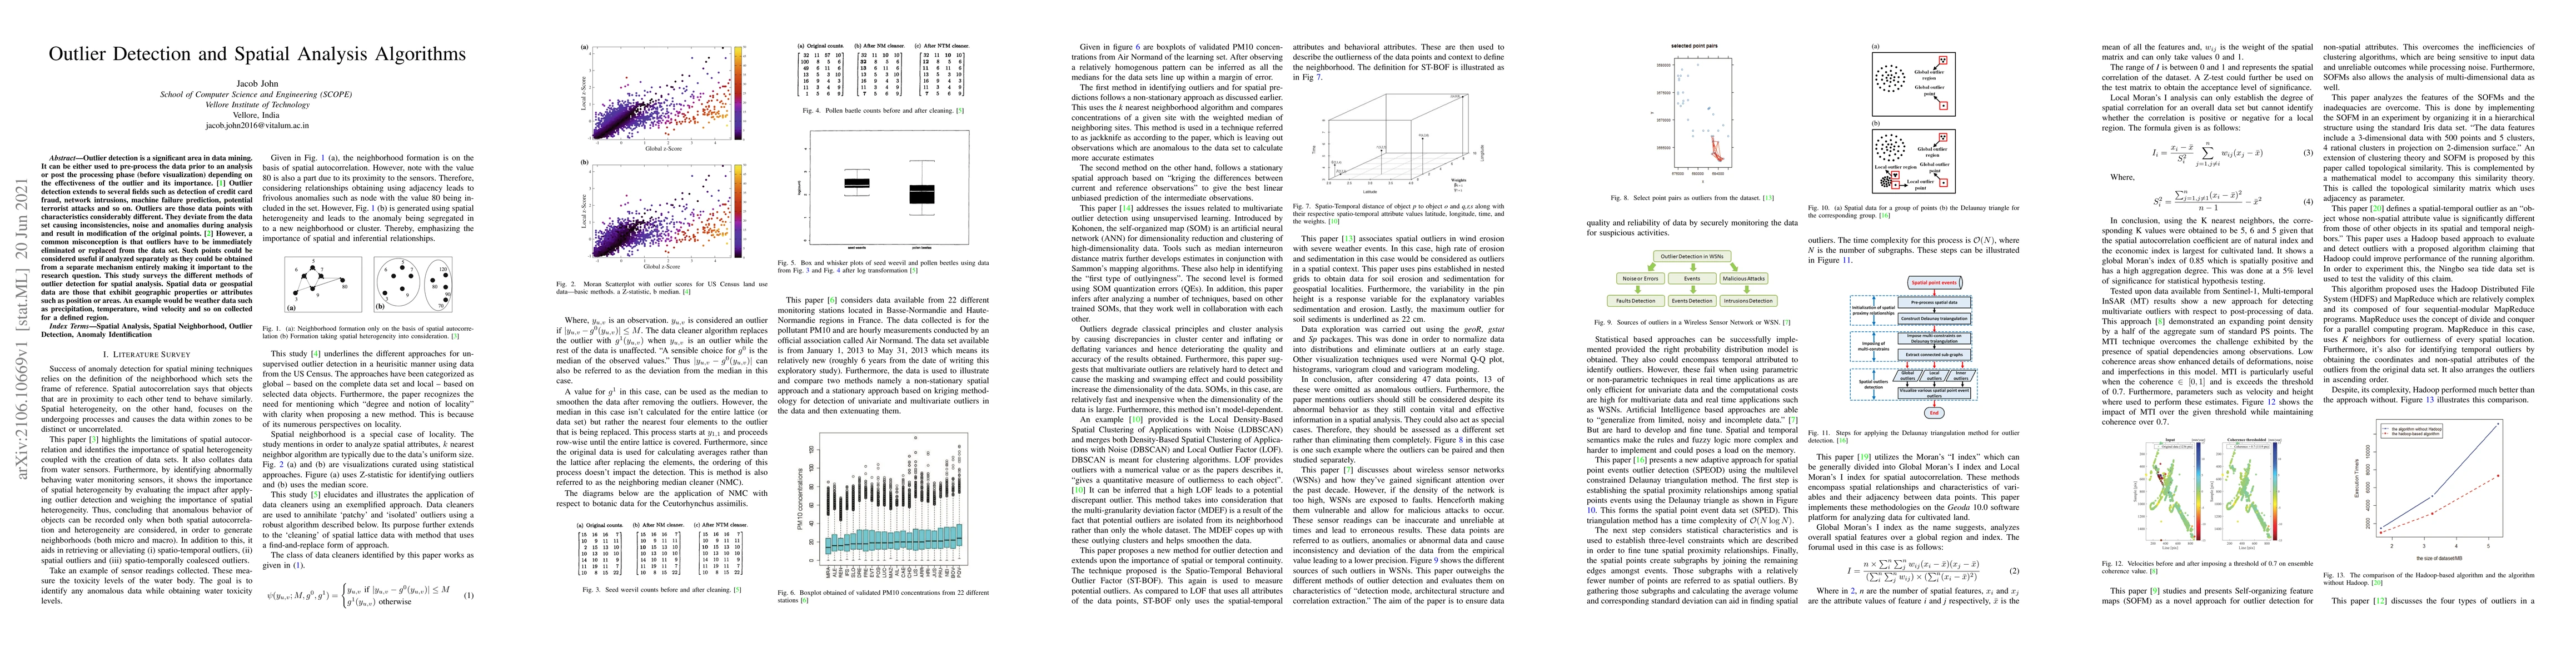
Outlier detection is a significant area in data mining. It can be either used to pre-process the data prior to an analysis or post the processing phase (before visualization) depending on the effectiveness of the outlier and its importance. Outlier detection extends to several fields such as detection of credit card fraud, network intrusions, machine failure prediction, potential terrorist attacks, and so on. Outliers are those data points with characteristics considerably different. They deviate from the data set causing inconsistencies, noise and anomalies during analysis and result in modification of the original points However, a common misconception is that outliers have to be immediately eliminated or replaced from the data set. Such points could be considered useful if analyzed separately as they could be obtained from a separate mechanism entirely making it important to the research question. This study surveys the different methods of outlier detection for spatial analysis. Spatial data or geospatial data are those that exhibit geographic properties or attributes such as position or areas. An example would be weather data such as precipitation, temperature, wind velocity, and so on collected for a defined region.
AI Key Findings
Get AI-generated insights about this paper's methodology, results, significance, and more — seven facets brought into focus.
Impact
Paper Details
Authors
PDF Preview
Key Terms
Citation Network
Current paper (gray), citations (green), references (blue)
Display is limited for performance on very large graphs.
Discussion 0