Summary
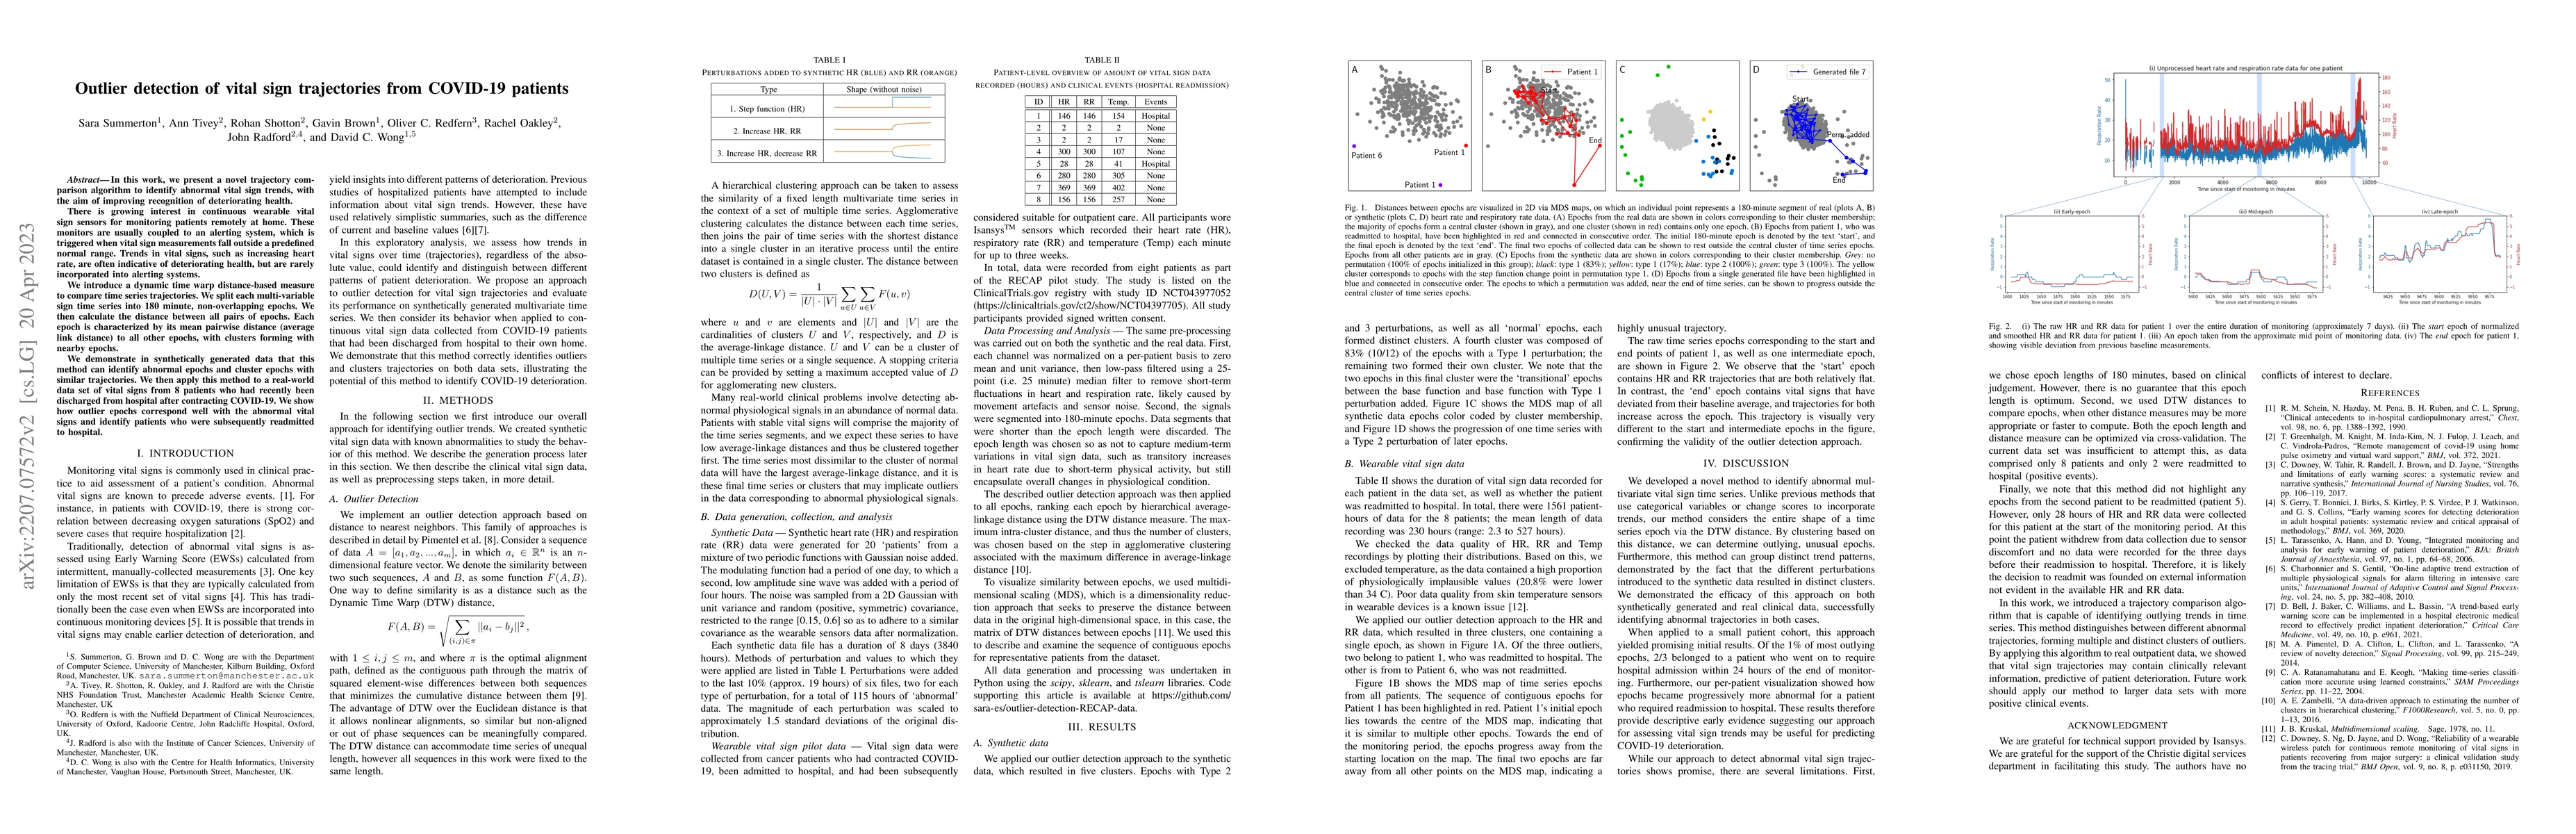
In this work, we present a novel trajectory comparison algorithm to identify abnormal vital sign trends, with the aim of improving recognition of deteriorating health. There is growing interest in continuous wearable vital sign sensors for monitoring patients remotely at home. These monitors are usually coupled to an alerting system, which is triggered when vital sign measurements fall outside a predefined normal range. Trends in vital signs, such as increasing heart rate, are often indicative of deteriorating health, but are rarely incorporated into alerting systems. We introduce a dynamic time warp distance-based measure to compare time series trajectories. We split each multi-variable sign time series into 180 minute, non-overlapping epochs. We then calculate the distance between all pairs of epochs. Each epoch is characterized by its mean pairwise distance (average link distance) to all other epochs, with clusters forming with nearby epochs. We demonstrate in synthetically generated data that this method can identify abnormal epochs and cluster epochs with similar trajectories. We then apply this method to a real-world data set of vital signs from 8 patients who had recently been discharged from hospital after contracting COVID-19. We show how outlier epochs correspond well with the abnormal vital signs and identify patients who were subsequently readmitted to hospital.
AI Key Findings
Get AI-generated insights about this paper's methodology, results, and significance.
Paper Details
PDF Preview
Key Terms
Citation Network
Current paper (gray), citations (green), references (blue)
Display is limited for performance on very large graphs.
Similar Papers
Found 4 papersPhotonic Radar for Contactless Vital Sign Detection
Yang Liu, Benjamin J. Eggleton, Ziqian Zhang et al.
Visualization and Analysis of Wearable Health Data From COVID-19 Patients
Sven Hirsch, Jens Eckstein, Susanne K. Suter et al.
Vital Measurements of Hospitalized COVID-19 Patients as a Predictor of Long COVID: An EHR-based Cohort Study from the RECOVER Program in N3C
Sihang Jiang, Donald Brown, Johanna Loomba et al.
No citations found for this paper.
Comments (0)