Summary
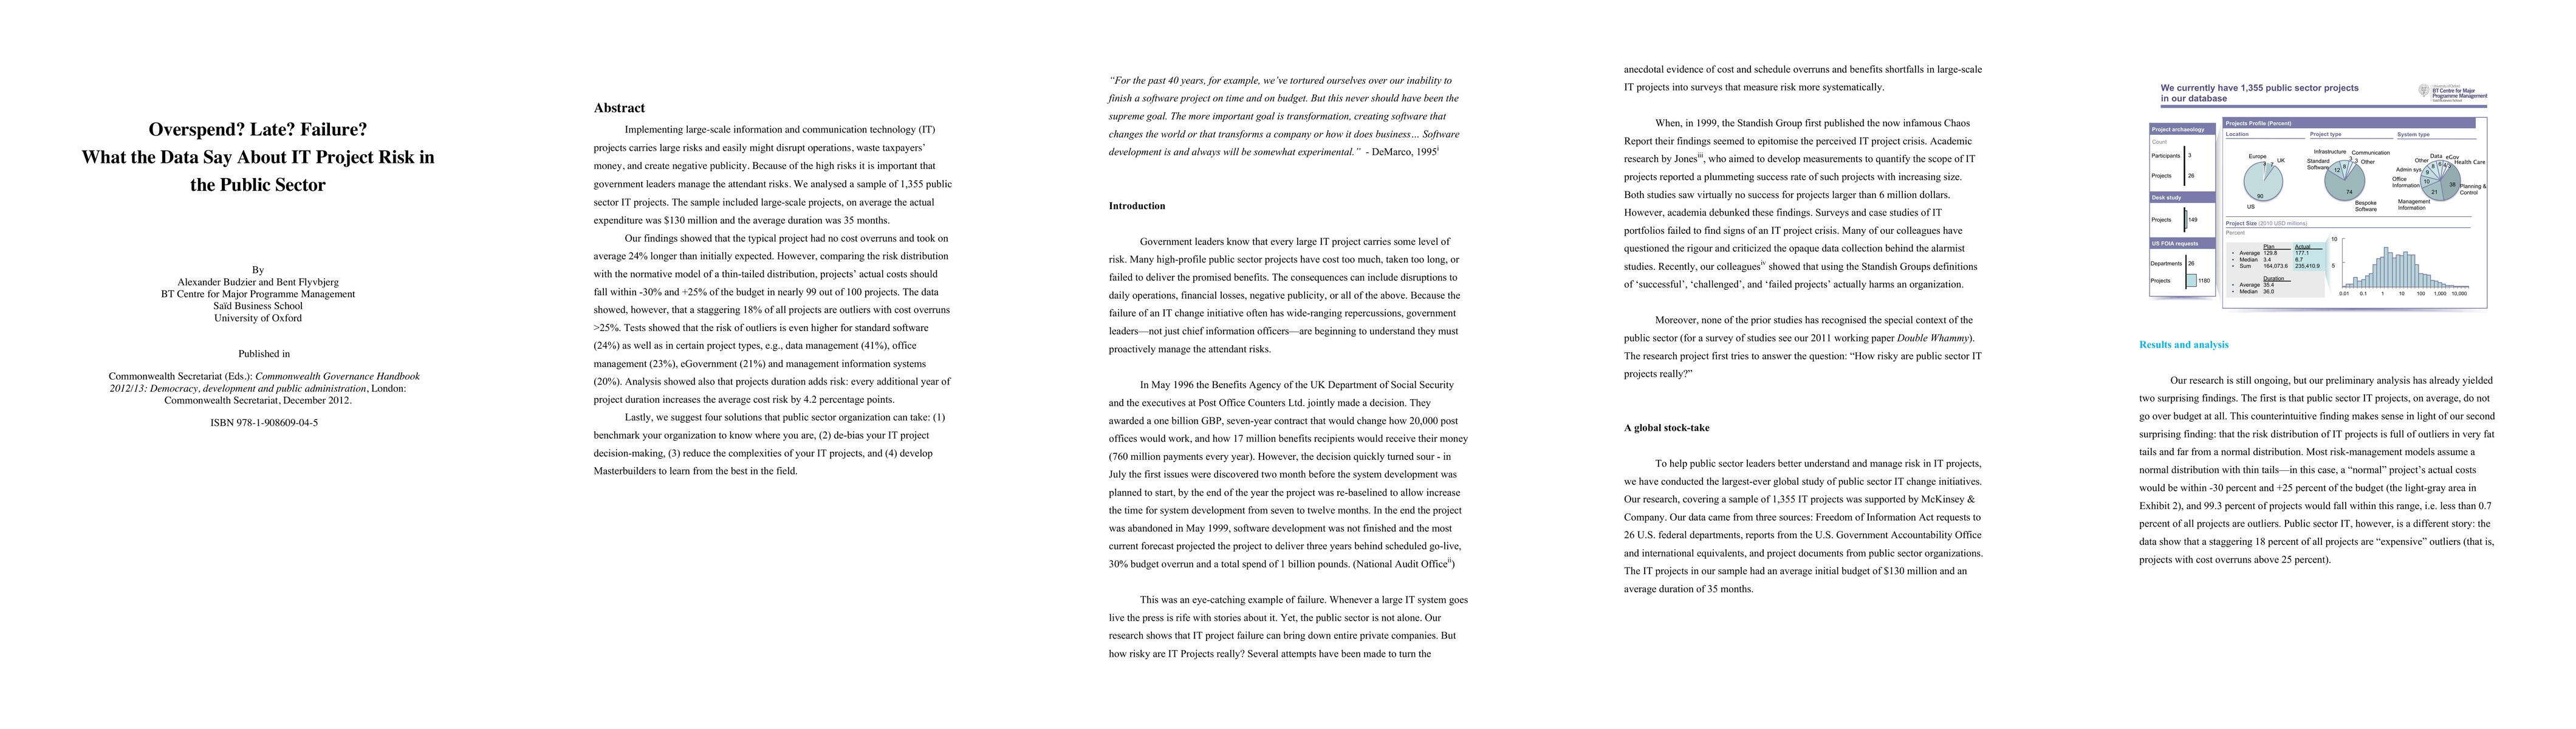
Implementing large-scale information and communication technology (IT) projects carries large risks and easily might disrupt operations, waste taxpayers' money, and create negative publicity. Because of the high risks it is important that government leaders manage the attendant risks. We analysed a sample of 1,355 public sector IT projects. The sample included large-scale projects, on average the actual expenditure was $130 million and the average duration was 35 months. Our findings showed that the typical project had no cost overruns and took on average 24% longer than initially expected. However, comparing the risk distribution with the normative model of a thin-tailed distribution, projects' actual costs should fall within -30% and +25% of the budget in nearly 99 out of 100 projects. The data showed, however, that a staggering 18% of all projects are outliers with cost overruns >25%. Tests showed that the risk of outliers is even higher for standard software (24%) as well as in certain project types, e.g., data management (41%), office management (23%), eGovernment (21%) and management information systems (20%). Analysis showed also that projects duration adds risk: every additional year of project duration increases the average cost risk by 4.2 percentage points. Lastly, we suggest four solutions that public sector organization can take: (1) benchmark your organization to know where you are, (2) de-bias your IT project decision-making, (3) reduce the complexities of your IT projects, and (4) develop Masterbuilders to learn from the best in the field.
AI Key Findings
Get AI-generated insights about this paper's methodology, results, and significance.
Paper Details
PDF Preview
Key Terms
Citation Network
Current paper (gray), citations (green), references (blue)
Display is limited for performance on very large graphs.
Similar Papers
Found 4 papersIt Is Not About What You Say, It Is About How You Say It: A Surprisingly Simple Approach for Improving Reading Comprehension
Katharina von der Wense, Sagi Shaier, Lawrence E Hunter
An approach to heart failure for the public-sector primary care clinician.
Von Pressentin, Klaus B, Rossouw, Liezel, Lachman, Anthony S
| Title | Authors | Year | Actions |
|---|
Comments (0)