ArxivLens

Quick Summary:

This paper explores colored graphical models for extreme values using multivariate Pareto distributions, introducing fully nonparametric extremal tree models and parametric H\"usler--Reiss distributions. It presents statistical methods for parameter estimation and demonstrates superior performance on real data compared to existing methods.

arXiv Id: 2306.00703
Comments: 24 pages, 9 figures
Date Published: 2023-06-02
Date Updated: 2023-06-02

Key Terms (TF-IDF):

graphical (0.337)
colored (0.329)
graphical (0.325)
extremal (0.286)
extremal (0.283)
distributions (0.239)
distributions (0.234)
multivariate (0.217)
parametric (0.198)
methodology (0.189)
tree (0.188)
methodology (0.184)
parametric (0.184)
tree (0.182)
models (0.165)
models (0.162)
coloring (0.151)
statements (0.143)
approaches (0.139)
License: http://arxiv.org/licenses/nonexclusive-distrib/1.0/

Summary:

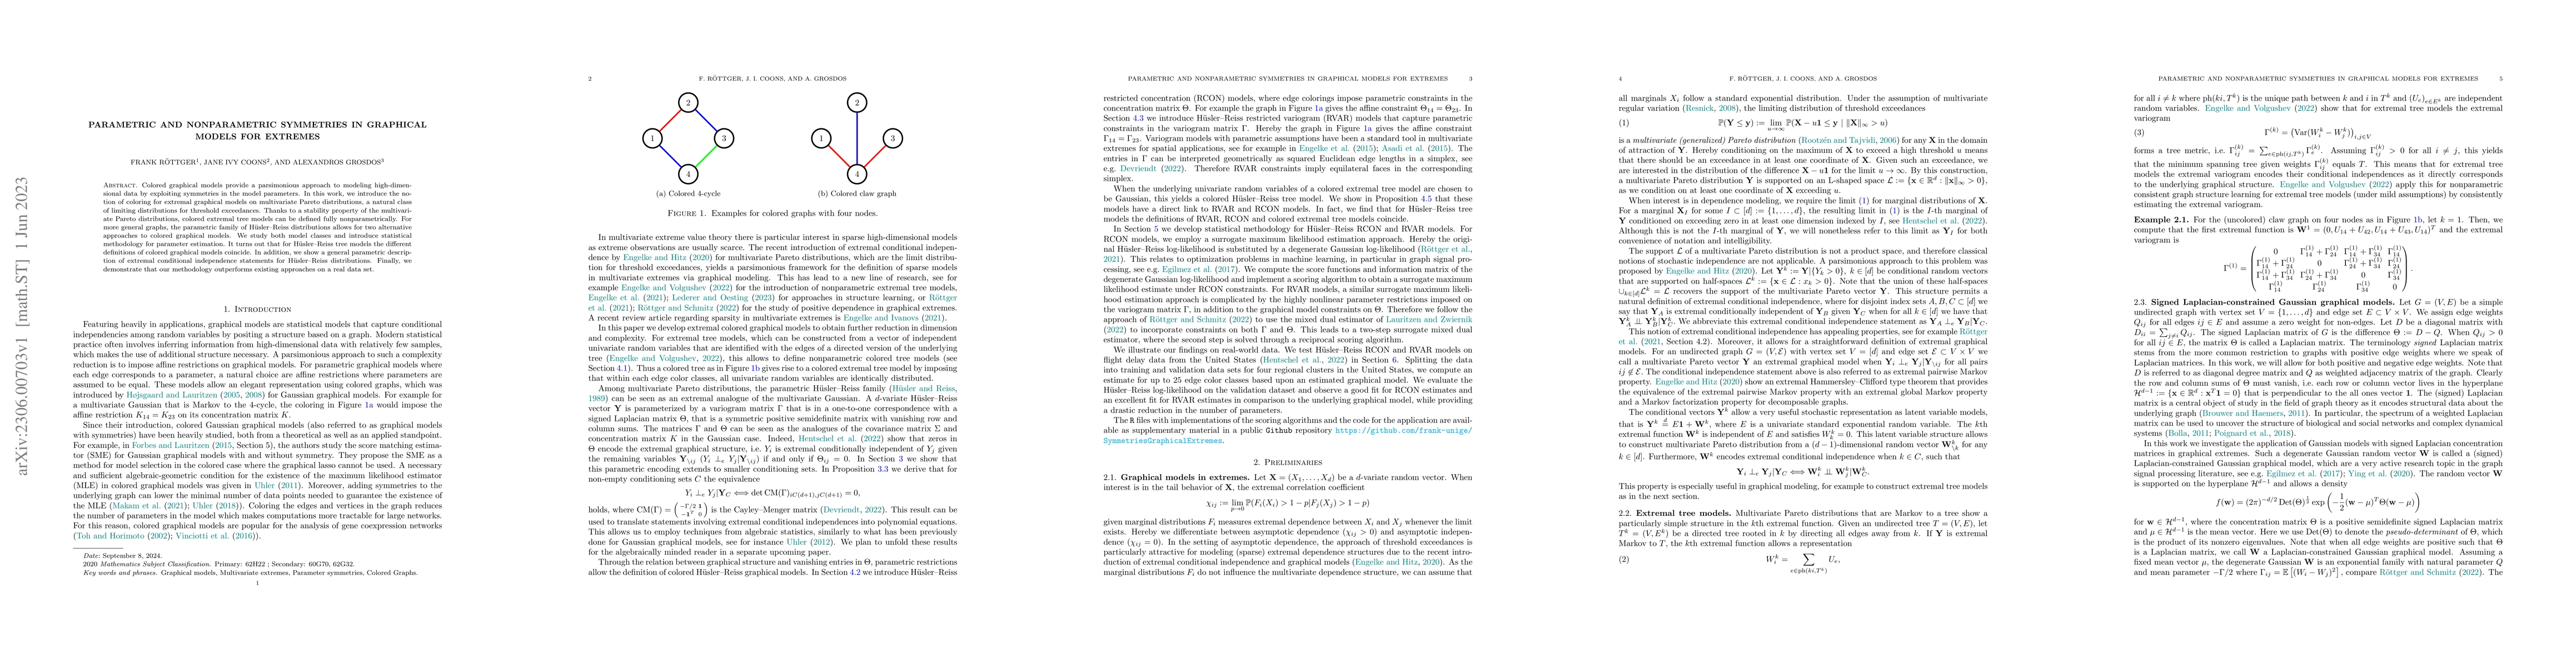
Colored graphical models provide a parsimonious approach to modeling high-dimensional data by exploiting symmetries in the model parameters. In this work, we introduce the notion of coloring for extremal graphical models on multivariate Pareto distributions, a natural class of limiting distributions for threshold exceedances. Thanks to a stability property of the multivariate Pareto distributions, colored extremal tree models can be defined fully nonparametrically. For more general graphs, the parametric family of H\"usler--Reiss distributions allows for two alternative approaches to colored graphical models. We study both model classes and introduce statistical methodology for parameter estimation. It turns out that for H\"usler--Reiss tree models the different definitions of colored graphical models coincide. In addition, we show a general parametric description of extremal conditional independence statements for H\"usler--Reiss distributions. Finally, we demonstrate that our methodology outperforms existing approaches on a real data set.

Citation & Reference Network Visualization

This graph shows how this paper is connected to other research. The current paper is shown in dark gray, papers that cite it are in green, and papers it references are in blue. You can:

Current Paper
Papers citing this work (Citations)
Papers cited by this work (References)

• Hover over any node to see the paper title

• Click a node to view that paper's details

• Drag nodes to rearrange the graph

• Use the zoom controls (bottom right) to zoom in/out

Citations and References

Title Authors Year Actions
Extremes of structural causal models
Sebastian Engelke, Nicola Gnecco, Frank Rottger
2025
View Paper
Extremal graphical modeling with latent variables via convex optimization
Sebastian Engelke, Armeen Taeb
2024
View Paper
Homaloidal polynomials and Gaussian models of maximum likelihood degree 1
Shelby Cox, Pratik Misra, Pardis Semnani
2024
View Paper
Graphical models for multivariate extremes
Sebastian Engelke, Manuel Hentschel, Michael Lalancette, Frank Rottger
2024
View Paper
Modeling extreme events: Univariate and multivariate data-driven approaches
Gloria Buritic'a, Manuel Hentschel, Olivier C. Pasche, Frank Rottger, Zhongwei Zhang
2024
View Paper
On pairwise interaction multivariate Pareto models
Michael Lalancette
2023
View Paper
On the local metric property in multivariate extremes
Frank Rottger, Quentin Schmitz
2022
View Paper
Statistical Inference for Hüsler–Reiss Graphical Models Through Matrix Completions
Manuel Hentschel, Sebastian Engelke, J. Segers
2022
View Paper

Similar Papers

Graphical models for multivariate extremes

Sebastian Engelke, Manuel Hentschel, Michaël Lalancette, Frank Röttger

Published: 2024-02-06

Conditional Extremes with Graphical Models

Aiden Farrell, Emma F. Eastoe, Clement Lee

Published: 2024-11-26

Comments (0)

This website uses cookies to ensure you get the best experience. Learn more