Publication
Metrics
AI Quick Summary
Researchers studied the electrical breakdown voltage of a PCB trace in low vacuum using a simplified model and measured its Paschen curve from 2x10^-3 mbar to 25 mbar.
Paper Preview
Abstract
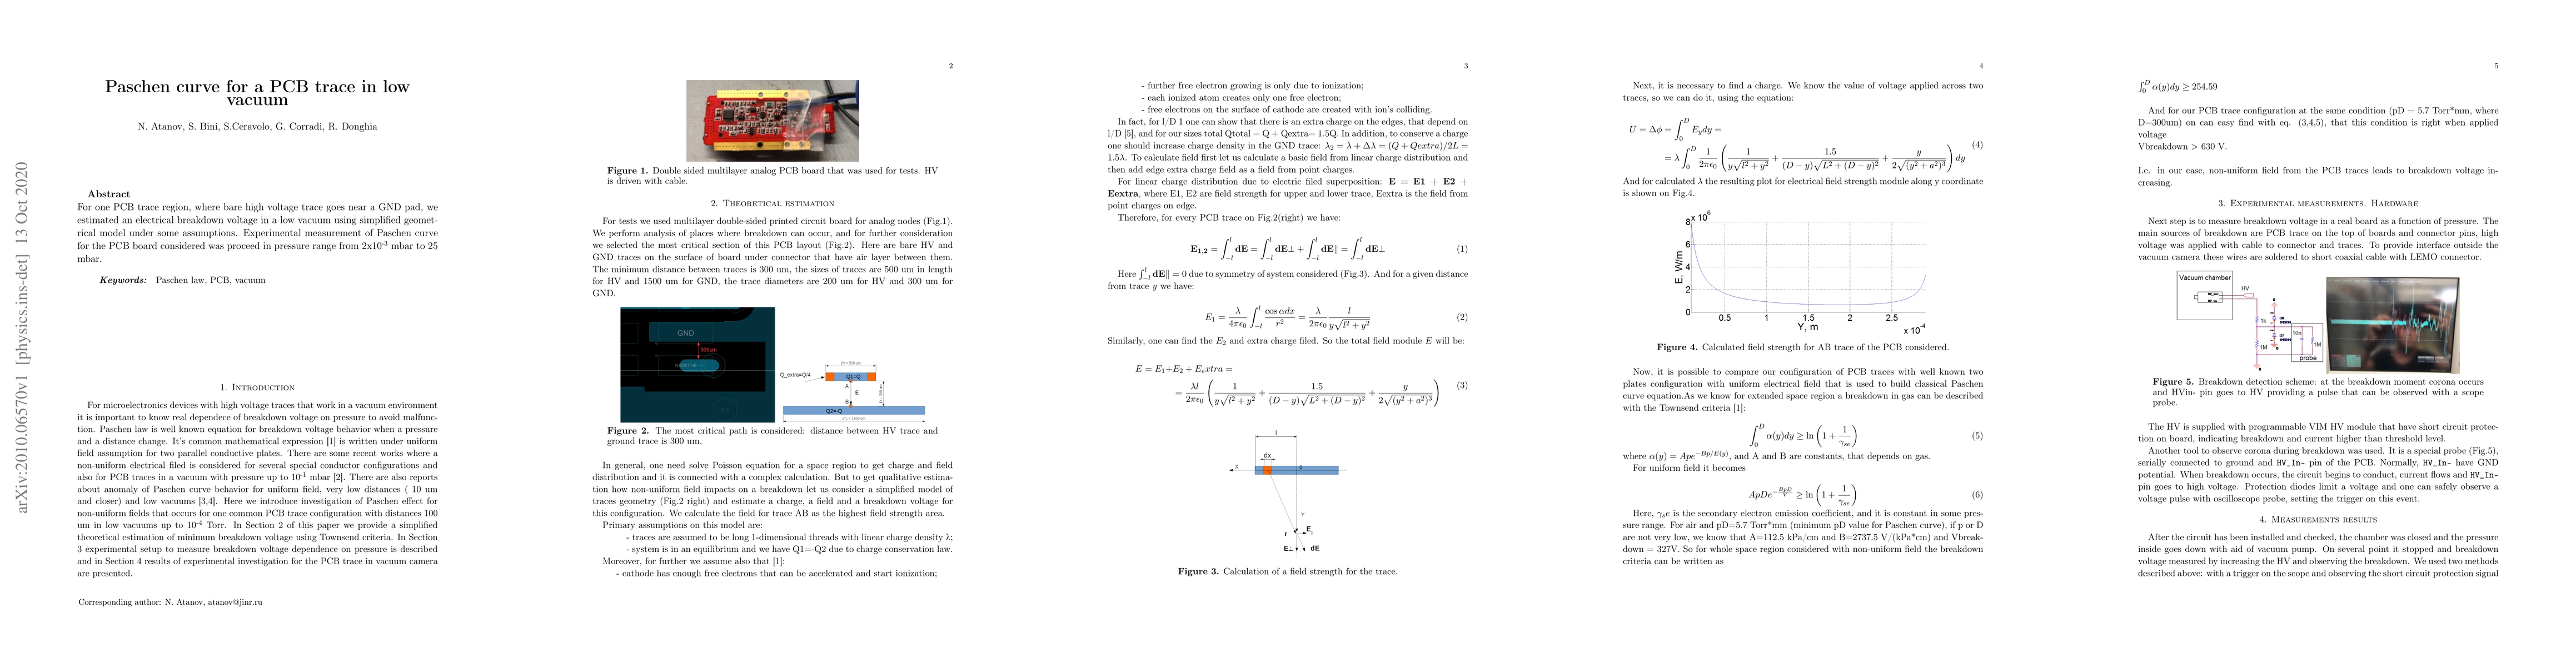
For one PCB trace region, where bare high voltage trace goes near GND pad, we estimated an electrical breakdown voltage in low vacuum using simplified geometrical model under some assumptions. Experimental measurement of Paschen curve for the PCB board considered was proceed in pressure range from 2x10⁻³ mbar to 25 mbar.
AI Key Findings
Get AI-generated insights about this paper's methodology, results, significance, and more — seven facets brought into focus.
Impact
Paper Details
Authors
PDF Preview
Key Terms
Citation Network
Current paper (gray), citations (green), references (blue)
Display is limited for performance on very large graphs.
Discussion 0