Summary
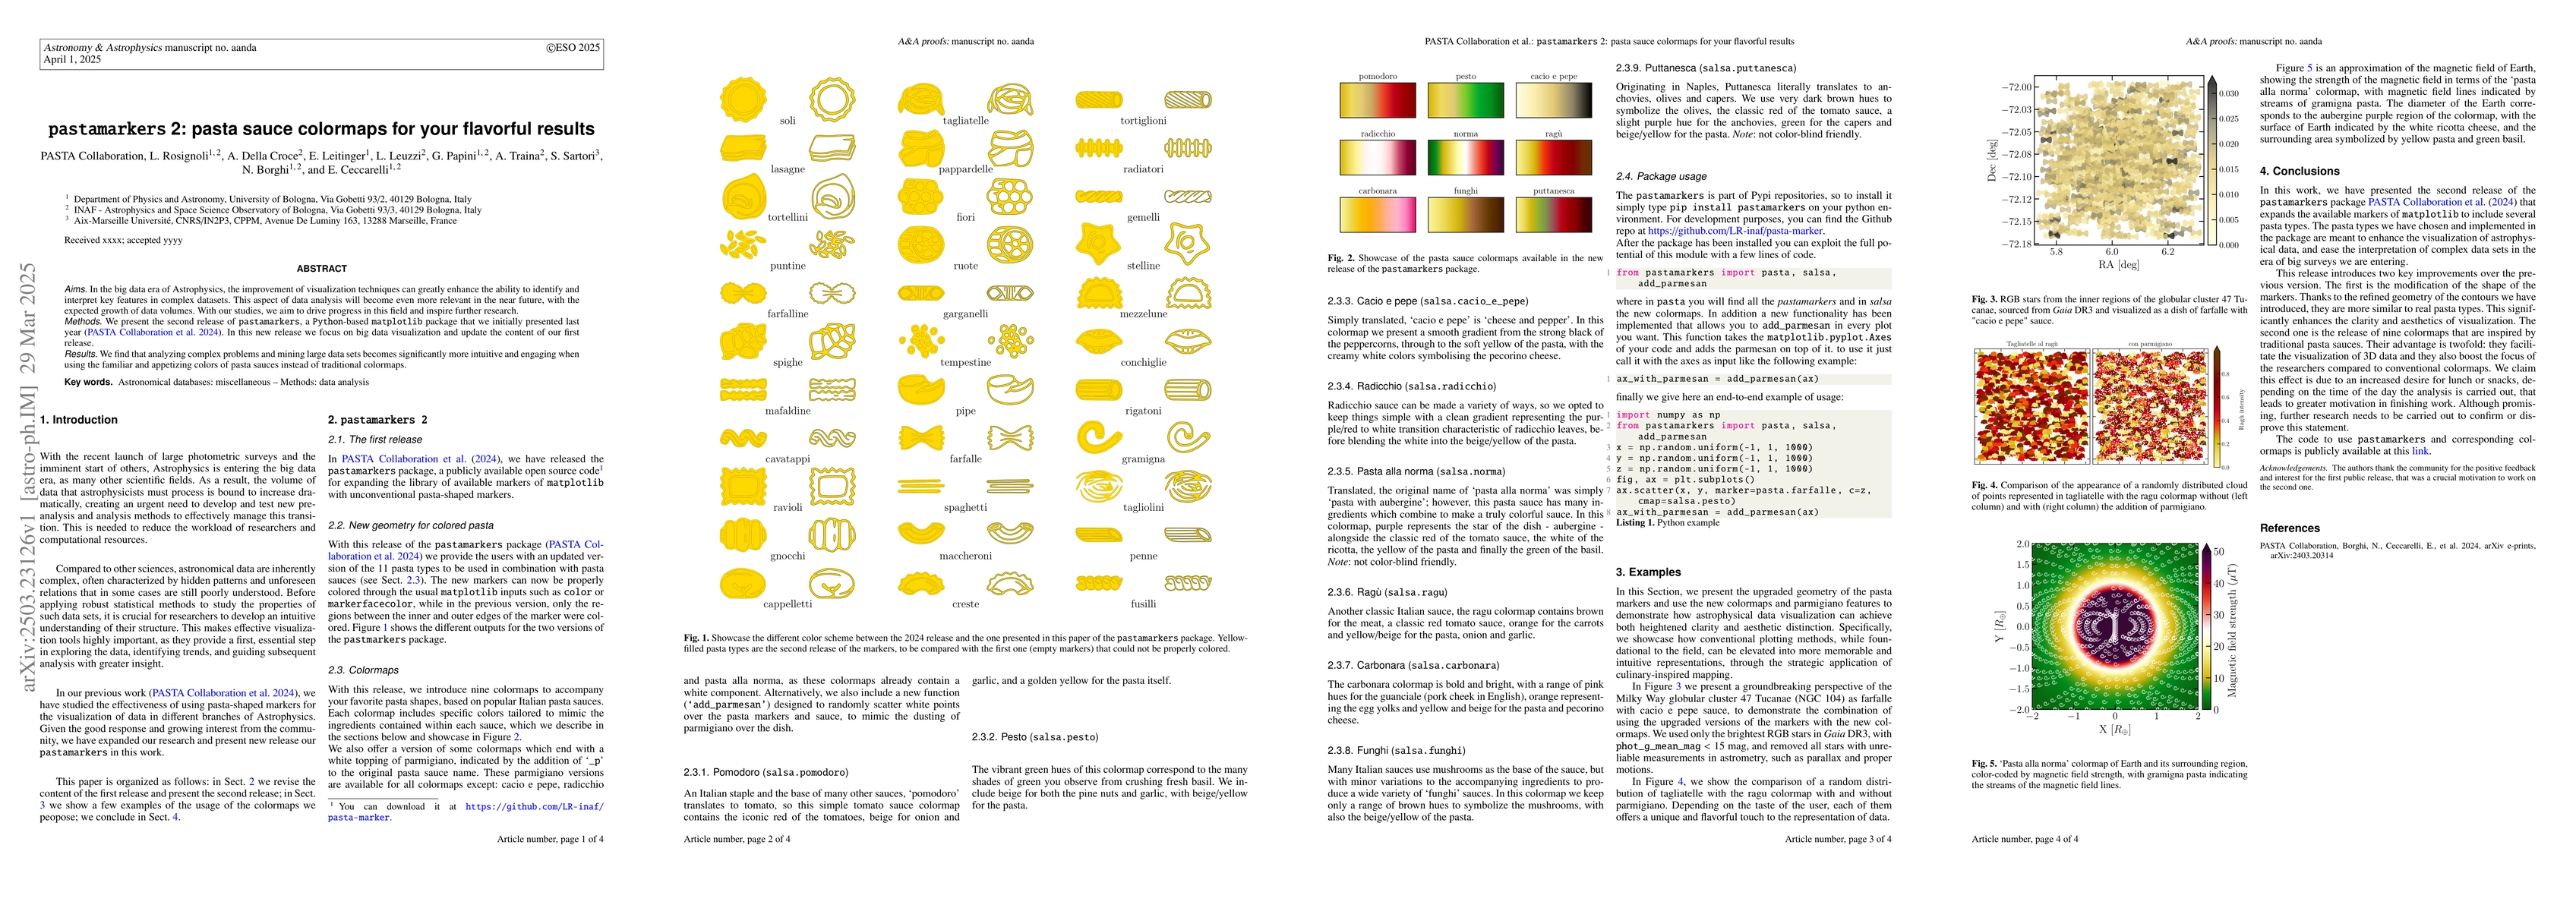
In the big data era of Astrophysics, the improvement of visualization techniques can greatly enhance the ability to identify and interpret key features in complex datasets. This aspect of data analysis will become even more relevant in the near future, with the expected growth of data volumes. With our studies, we aim to drive progress in this field and inspire further research. We present the second release of pastamarkers, a Python-based matplotlib package that we initially presented last year. In this new release we focus on big data visualization and update the content of our first release. We find that analyzing complex problems and mining large data sets becomes significantly more intuitive and engaging when using the familiar and appetizing colors of pasta sauces instead of traditional colormaps.
AI Key Findings
Generated Jun 10, 2025
Methodology
The research presents the second release of pastamarkers, a Python-based matplotlib package, focusing on big data visualization. It updates the content of the first release, providing new geometry for colored pasta and introducing nine colormaps inspired by popular Italian pasta sauces.
Key Results
- Analyzing complex problems and mining large datasets becomes more intuitive and engaging with pasta sauce-inspired colormaps.
- The new release offers improved marker shapes that are more similar to real pasta types, enhancing visualization clarity and aesthetics.
Significance
This research aims to improve data visualization techniques in the big data era of astrophysics, making it easier for researchers to identify and interpret key features in complex datasets.
Technical Contribution
The pastamarkers package expands matplotlib's marker library with unconventional pasta-shaped markers and introduces nine colormaps based on popular Italian pasta sauces.
Novelty
The research introduces culinary-inspired mapping for data visualization in astrophysics, offering a unique and engaging alternative to traditional colormaps.
Limitations
- The color-blind-friendliness of some colormaps is not guaranteed, as mentioned in the radicchio sauce colormap description.
- The claimed increased motivation due to pasta sauce colormaps requires further research to confirm.
Future Work
- Explore and confirm the motivational impact of pasta sauce-inspired colormaps on researchers.
- Address color-blind-friendliness concerns by developing alternative colormaps or providing options.
Paper Details
PDF Preview
Similar Papers
Found 4 paperspastamarkers: astrophysical data visualization with pasta-like markers
L. Leuzzi, A. Della Croce, PASTA Collaboration et al.
Phase behavior of Cacio and Pepe sauce
Alberto Corticelli, Daniel Maria Busiello, Matteo Ciarchi et al.
No citations found for this paper.
Comments (0)