Summary
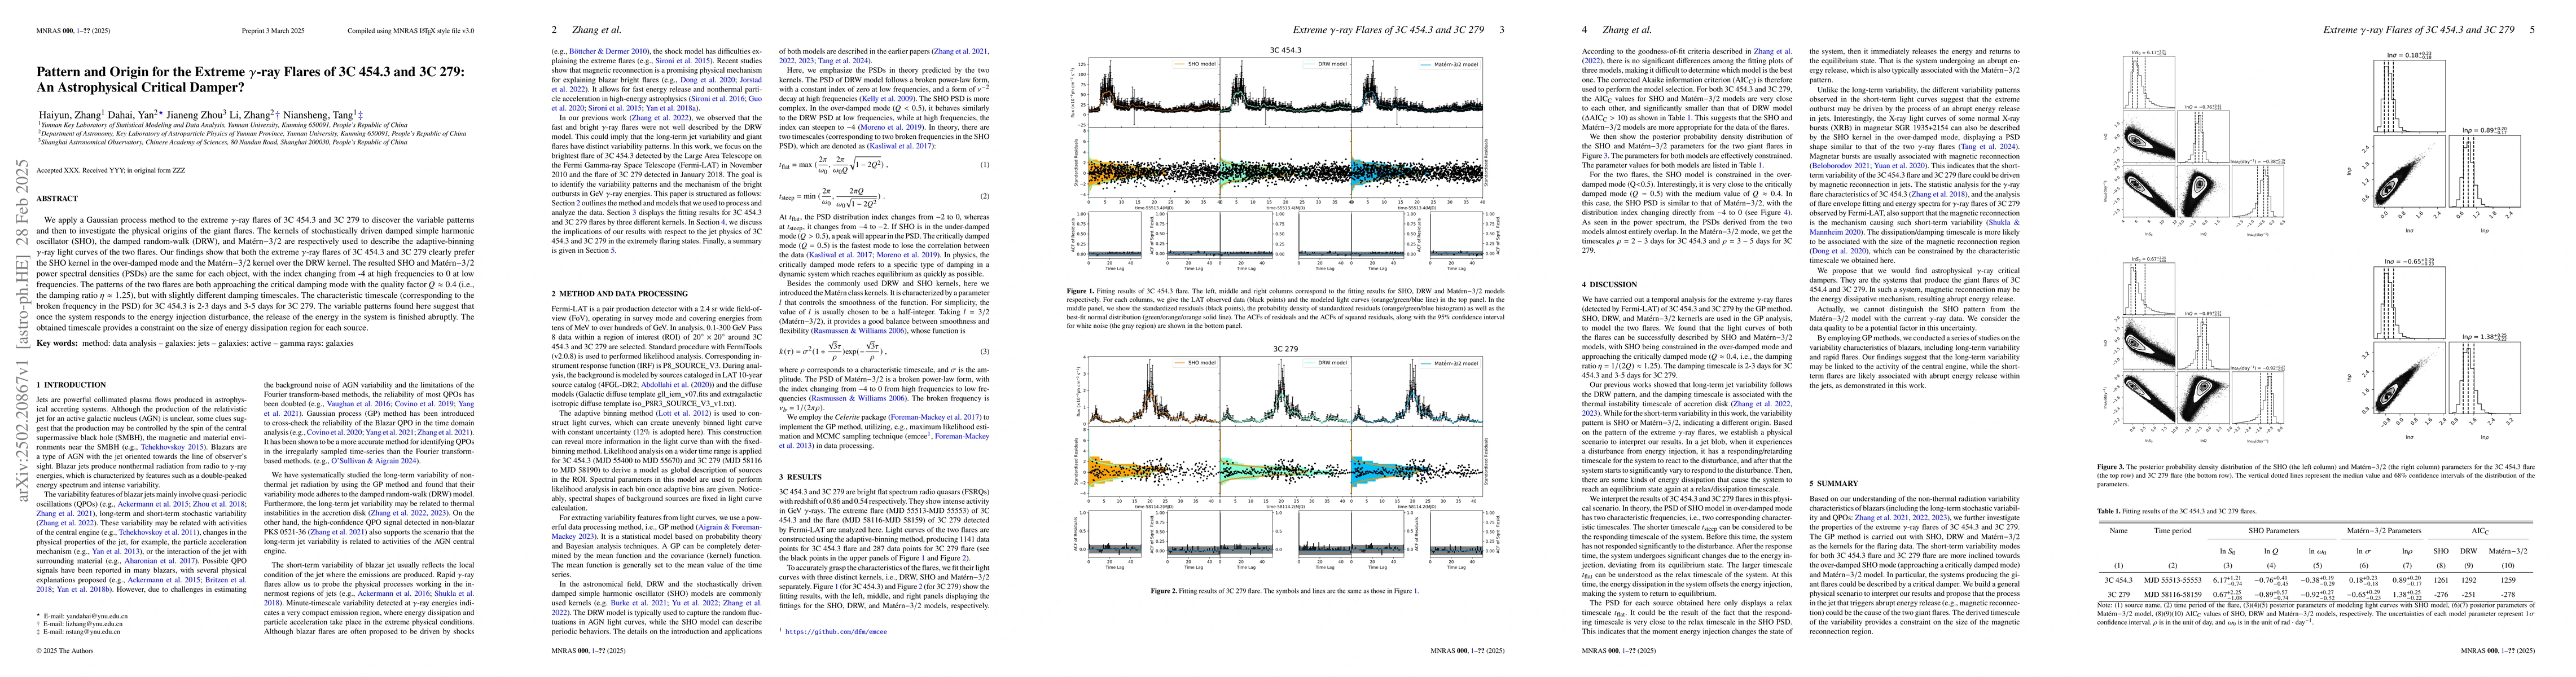
We apply a Gaussian process method to the extreme $\gamma$-ray flares of 3C 454.3 and 3C 279 to discover the variable patterns and then to investigate the physical origins of the giant flares. The kernels of stochastically driven damped simple harmonic oscillator (SHO), the damped random-walk (DRW), and Mat$\acute{\rm e}$rn-3/2 are respectively used to describe the adaptive-binning $\gamma$-ray light curves of the two flares. Our findings show that both the extreme $\gamma$-ray flares of 3C 454.3 and 3C 279 clearly prefer the SHO kernel in the over-damped mode and the Mat$\acute{\rm e}$rn-3/2 kernel over the DRW kernel. The resulted SHO and Mat$\acute{\rm e}$rn-3/2 power spectral densities (PSDs) are the same for each object, with the index changing from -4 at high frequencies to 0 at low frequencies. The patterns of the two flares are both approaching the critical damping mode with the quality factor Q $\approx$ 0.4 (i.e., the damping ratio $\eta \approx$ 1.25), but with slightly different damping timescales. The characteristic timescale (corresponding to the broken frequency in the PSD) for 3C 454.3 is 2-3 days and 3-5 days for 3C 279. The variable patterns found here suggest that once the system responds to the energy injection disturbance, the release of the energy in the system is finished abruptly. The obtained timescale provides a constraint on the size of energy dissipation region for each source.
AI Key Findings
Generated Jun 10, 2025
Methodology
The research applies a Gaussian process (GP) method to analyze extreme γ-ray flares of 3C 454.3 and 3C 279 using adaptive-binning light curves. Kernels such as stochastically driven damped simple harmonic oscillator (SHO), damped random-walk (DRW), and Matérn-3/2 are used to model the flares.
Key Results
- Both 3C 454.3 and 3C 279 flares prefer the SHO kernel in the over-damped mode and the Matérn-3/2 kernel over the DRW kernel.
- Power spectral densities (PSDs) derived from SHO and Matérn-3/2 models for both flares show a change in index from -4 at high frequencies to 0 at low frequencies.
- The variable patterns of the flares suggest an abrupt energy release followed by equilibrium, with characteristic timescales of 2-3 days for 3C 454.3 and 3-5 days for 3C 279.
- The results indicate that magnetic reconnection could be the mechanism driving the short-term variability in these extreme γ-ray flares.
Significance
This study provides insights into the physical origins of extreme γ-ray flares in blazars, suggesting that magnetic reconnection might be responsible for the rapid energy release observed in these events.
Technical Contribution
The application of Gaussian process methods with SHO, DRW, and Matérn-3/2 kernels to model extreme γ-ray flares of 3C 454.3 and 3C 279, providing a detailed analysis of their variability patterns.
Novelty
This work distinguishes itself by identifying the critical damping mode in the variability patterns of extreme γ-ray flares, suggesting magnetic reconnection as a plausible mechanism for rapid energy release in blazar jets.
Limitations
- The research relies on specific kernel models which may not capture all possible variability patterns.
- The analysis is limited to γ-ray flares detected by Fermi-LAT, potentially missing information from other wavelengths or instruments.
Future Work
- Investigate the applicability of these findings to other blazars and γ-ray flares.
- Explore the use of additional or alternative kernel models to better understand the variability patterns.
Paper Details
PDF Preview
No citations found for this paper.
Comments (0)