Publication
Metrics
AI Quick Summary
This paper proposes a method to introduce frequency variability in vital signs using frequency modulation, enabling spectrograms to better capture patterns. The approach is evaluated on four medical datasets, achieving 91.55% accuracy in prediction and 91.67% in classification tasks, demonstrating its efficacy.
Paper Preview
Abstract
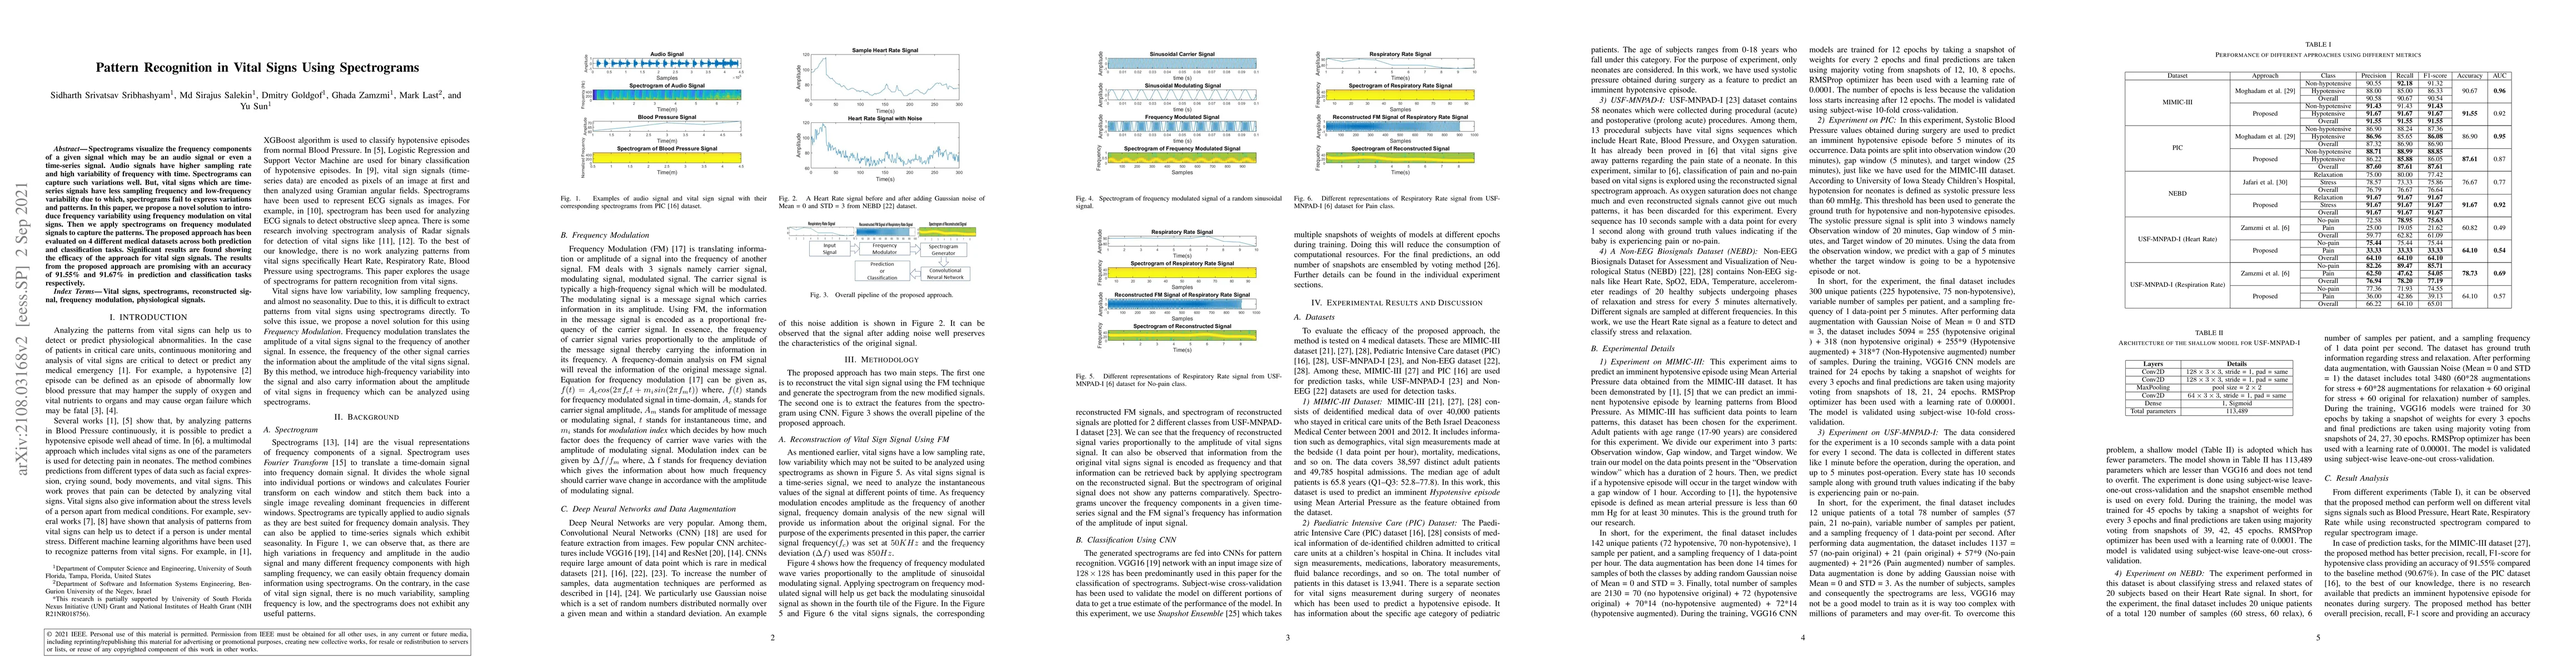
Spectrograms visualize the frequency components of a given signal which may be an audio signal or even a time-series signal. Audio signals have higher sampling rate and high variability of frequency with time. Spectrograms can capture such variations well. But, vital signs which are time-series signals have less sampling frequency and low-frequency variability due to which, spectrograms fail to express variations and patterns. In this paper, we propose a novel solution to introduce frequency variability using frequency modulation on vital signs. Then we apply spectrograms on frequency modulated signals to capture the patterns. The proposed approach has been evaluated on 4 different medical datasets across both prediction and classification tasks. Significant results are found showing the efficacy of the approach for vital sign signals. The results from the proposed approach are promising with an accuracy of 91.55% and 91.67% in prediction and classification tasks respectively.
AI Key Findings
Get AI-generated insights about this paper's methodology, results, significance, and more — seven facets brought into focus.
Impact
Paper Details
Authors
PDF Preview
Key Terms
Citation Network
Current paper (gray), citations (green), references (blue)
Display is limited for performance on very large graphs.
Discussion 0