Publication
Metrics
AI Quick Summary
This paper tests a new method to define percentile classes for the Integrated Impact Indicator (I3), ensuring the highest-ranked item always falls in the 100th percentile. However, it finds that this method could disadvantage highly-cited papers, as all uncited papers in a small set might rank in the 90th percentile. Despite these concerns, the authors updated their I3 computation software to include this option.
Paper Preview
Abstract
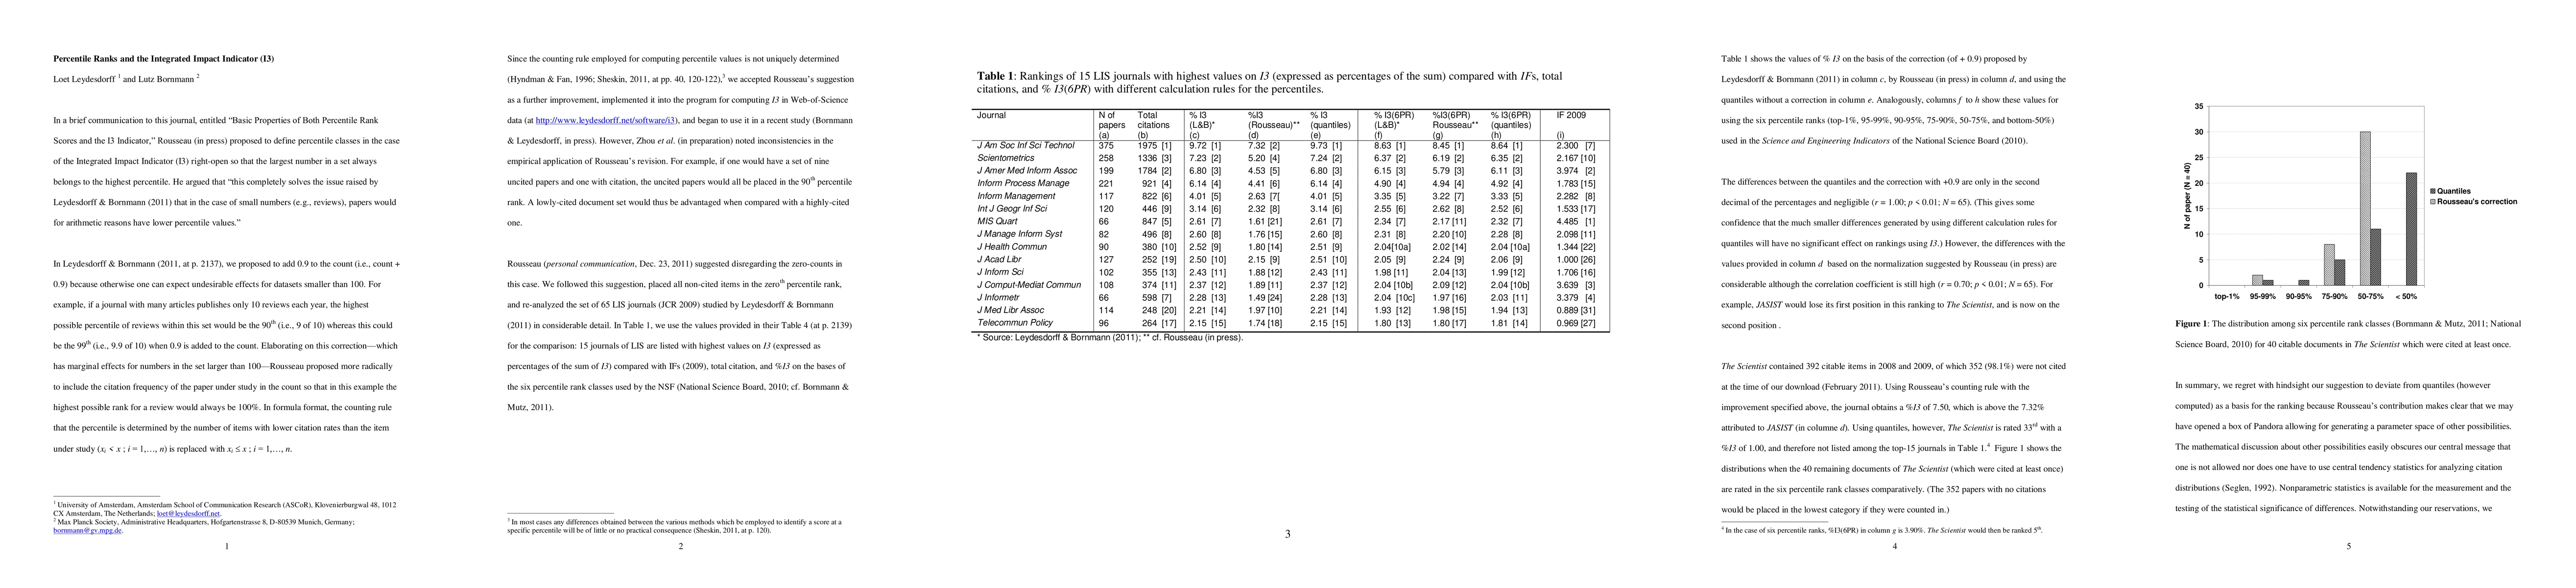
We tested Rousseau's (in press) recent proposal to define percentile classes in the case of the Integrated Impact Indicator (I3) so that the largest number in a set always belongs to the highest (100th) percentile rank class. In the case a set of nine uncited papers and one with citation, however, the uncited papers would all be placed in the 90th percentile rank. A lowly-cited document set would thus be advantaged when compared with a highly-cited one. Notwithstanding our reservations, we extended the program for computing I3 in Web-of-Science data (at http://www.leydesdorff.net/software/i3) with this option; the quantiles without a correction are now the default. As Rousseau mentions, excellence indicators (e.g., the top-10%) can be considered as special cases of I3: only two percentile rank classes are distinguished for the evaluation. Both excellence and impact indicators can be tested statistically using the z-test for independent proportions.
AI Key Findings
Get AI-generated insights about this paper's methodology, results, significance, and more — seven facets brought into focus.
Impact
Paper Details
PDF Preview
Key Terms
Citation Network
Current paper (gray), citations (green), references (blue)
Display is limited for performance on very large graphs.
Discussion 0