Publication
Metrics
AI Quick Summary
This research investigates how line attributes like width, dashing, and luminance are perceived for encoding scalar data, particularly uncertainty. Three studies reveal that width allows for more distinguishable levels than other attributes, providing guidelines for effective visualization of uncertainty and other scalar data.
Paper Preview
Abstract
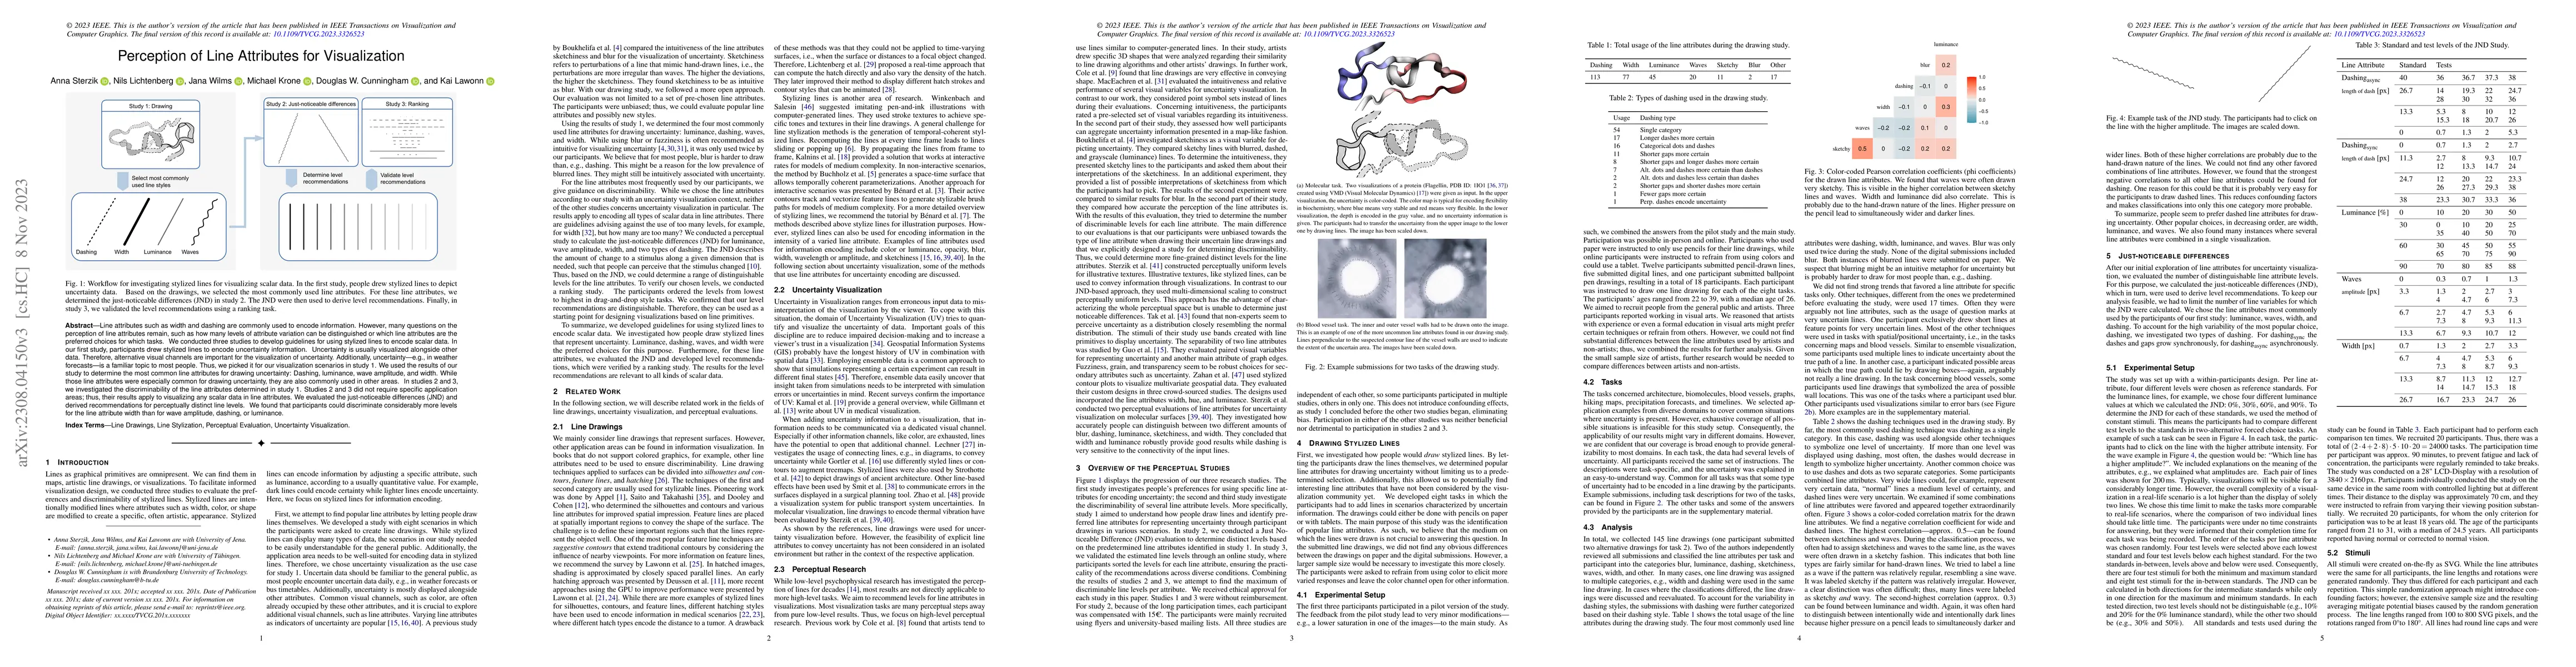
Line attributes such as width and dashing are commonly used to encode information. However, many questions on the perception of line attributes remain, such as how many levels of attribute variation can be distinguished or which line attributes are the preferred choices for which tasks. We conducted three studies to develop guidelines for using stylized lines to encode scalar data. In our first study, participants drew stylized lines to encode uncertainty information. Uncertainty is usually visualized alongside other data. Therefore, alternative visual channels are important for the visualization of uncertainty. Additionally, uncertainty -- e.g., in weather forecasts -- is a familiar topic to most people. Thus, we picked it for our visualization scenarios in study 1. We used the results of our study to determine the most common line attributes for drawing uncertainty: Dashing, luminance, wave amplitude, and width. While those line attributes were especially common for drawing uncertainty, they are also commonly used in other areas. In studies 2 and 3, we investigated the discriminability of the line attributes determined in study 1. Studies 2 and 3 did not require specific application areas; thus, their results apply to visualizing any scalar data in line attributes. We evaluated the just-noticeable differences (JND) and derived recommendations for perceptually distinct line levels. We found that participants could discriminate considerably more levels for the line attribute width than for wave amplitude, dashing, or luminance.
AI Key Findings
Get AI-generated insights about this paper's methodology, results, significance, and more — seven facets brought into focus.
Impact
Paper Details
Authors
PDF Preview
Key Terms
Citation Network
Current paper (gray), citations (green), references (blue)
Display is limited for performance on very large graphs.
Discussion 0