This paper employs Peres' method to represent interacting boson model spectra as lattices, revealing signatures of regularity or chaos in quantum and classical dynamics through ordered or disordered lattices. The technique also identifies exact or approximate dynamical symmetry.
A method by Peres is used to draw spectra of the interacting boson model as lattices in the plane of energy versus an arbitrary observable average (or variance). Ordered (disordered) lattices are signatures of regularity (chaos) in both quantum and classical dynamics. The method is also apt to disclose exact or approximate dynamical symmetry.
Generated Sep 02, 2025
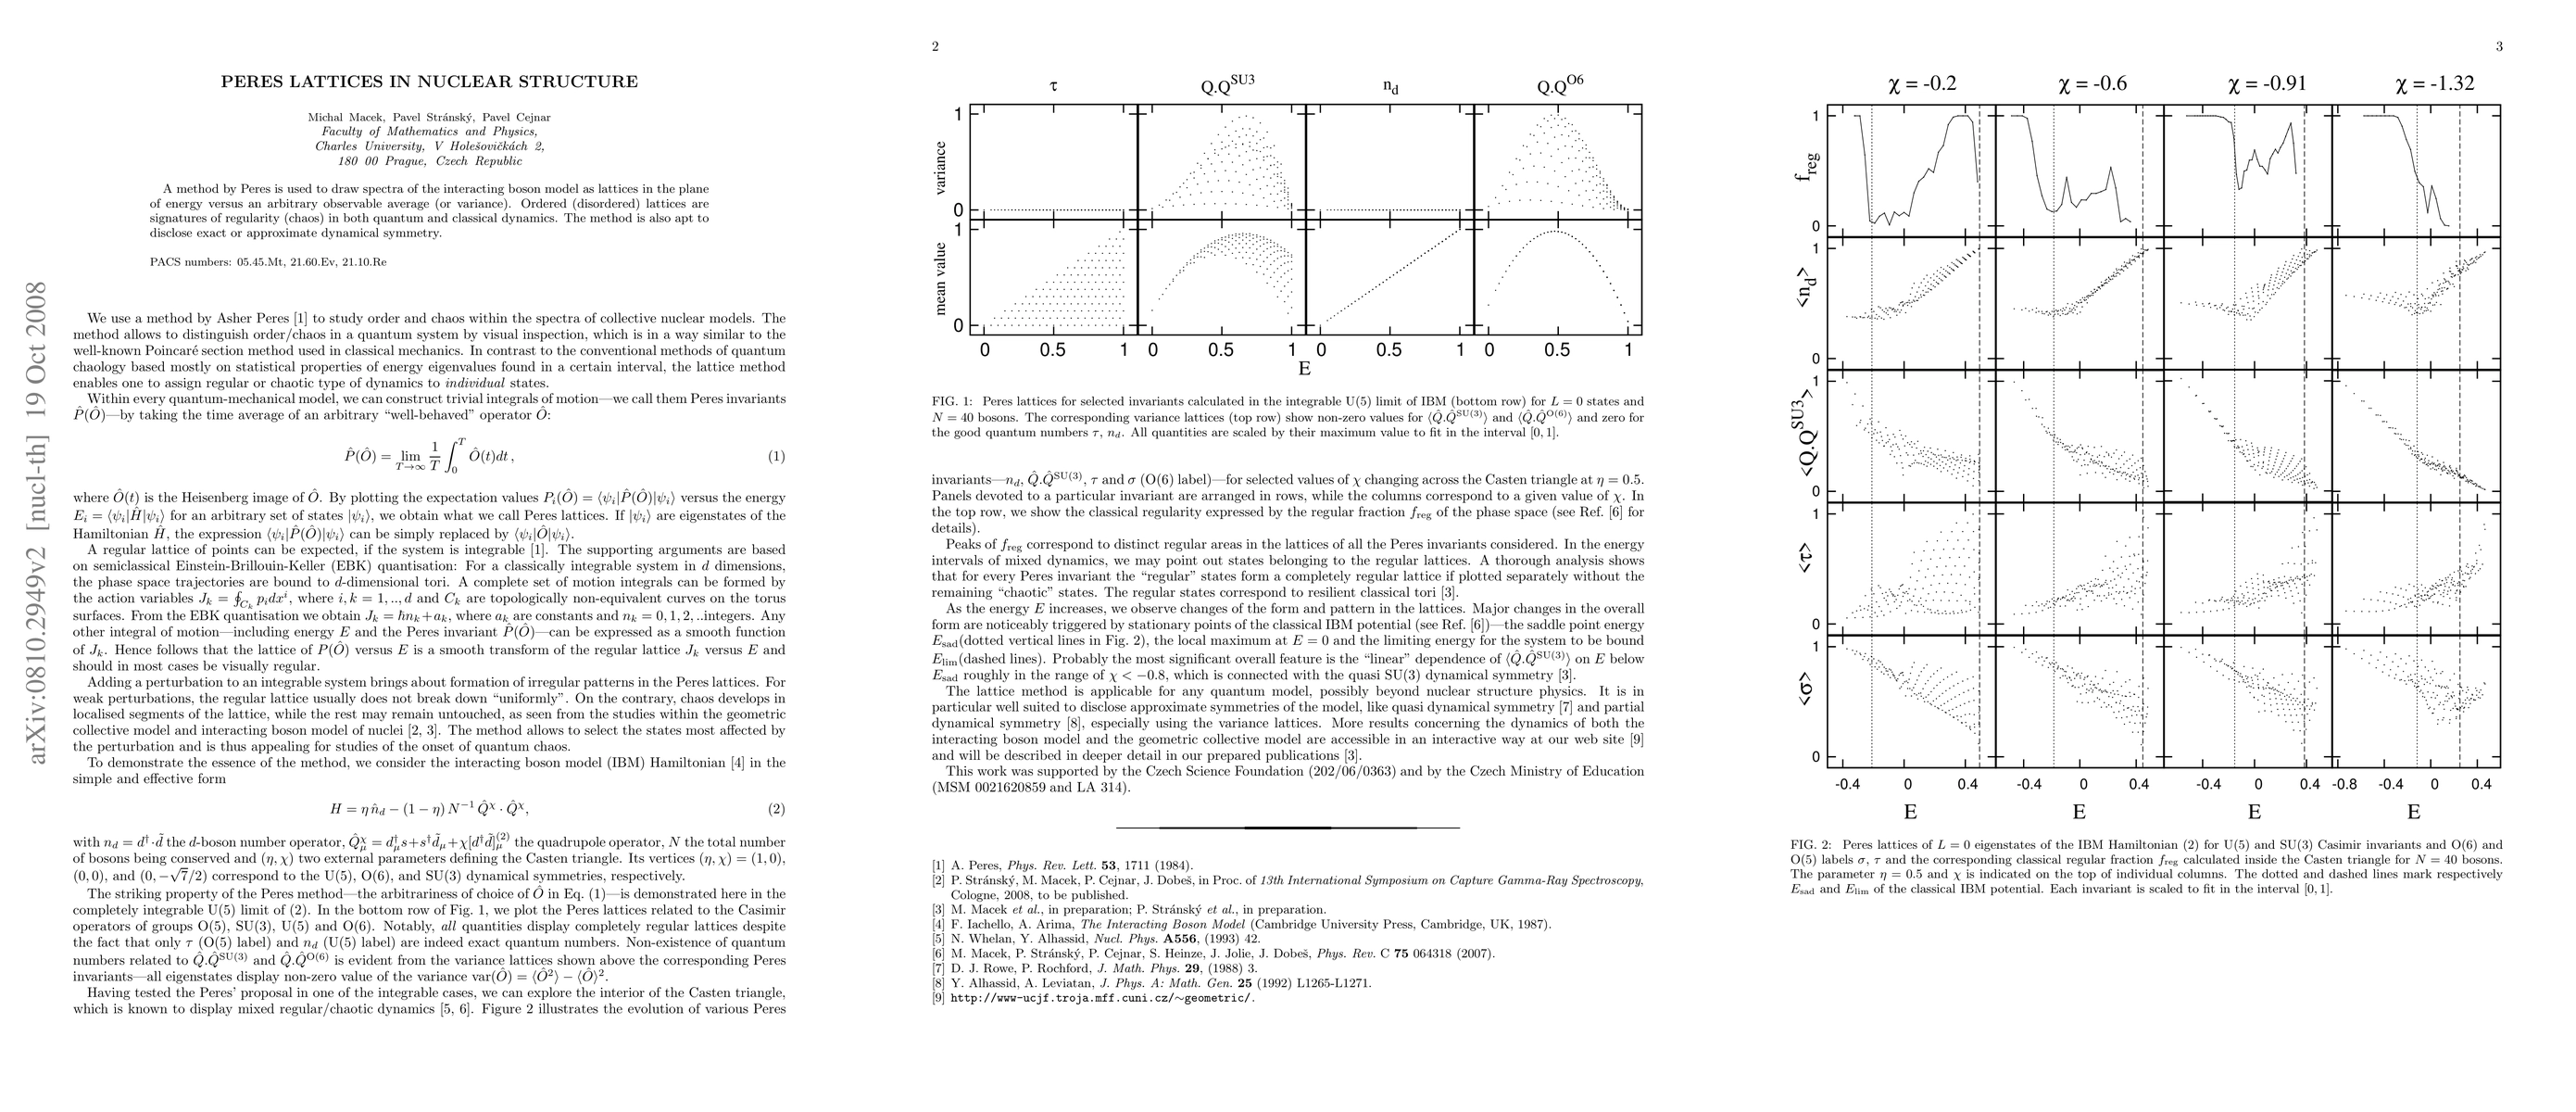
The research employs a method by Asher Peres to study order and chaos within the spectra of collective nuclear models. It allows distinguishing regular or chaotic dynamics in quantum systems through visual inspection, similar to the Poincaré section method in classical mechanics. The method constructs trivial integrals of motion, called Peres invariants, and plots their expectation values against energy levels to form Peres lattices.
This research is important as it provides a novel method to visualize and distinguish regular and chaotic dynamics in quantum systems, which can be applied to any quantum model beyond nuclear structure physics. It helps disclose approximate symmetries of the model, such as quasi-SU(3) dynamical symmetry, and can be useful for understanding the dynamics of complex quantum systems.
The main technical contribution is the application of Peres' method to distinguish regular and chaotic dynamics in quantum systems by constructing Peres lattices, which visually represent the time-averaged expectation values of an arbitrary operator against energy levels.
The novelty of this work lies in its application of Peres' method to collective nuclear models, enabling the visualization of regular and chaotic dynamics in individual quantum states, which differs from conventional statistical-based quantum chaology methods.
Current paper (gray), citations (green), references (blue)
Display is limited for performance on very large graphs.
| Title | Authors | Year | Actions |
|---|
Comments (0)