Publication
Metrics
AI Quick Summary
This paper demonstrates that radar performance prediction for coherent noise radars can be effectively carried out using the correlation coefficient instead of the traditional signal-to-noise ratio (SNR). It derives the range dependence of the correlation coefficient and combines it with a receiver operating characteristic curve, showing its viability as an alternative metric to SNR for radar performance analysis.
Paper Preview
Abstract
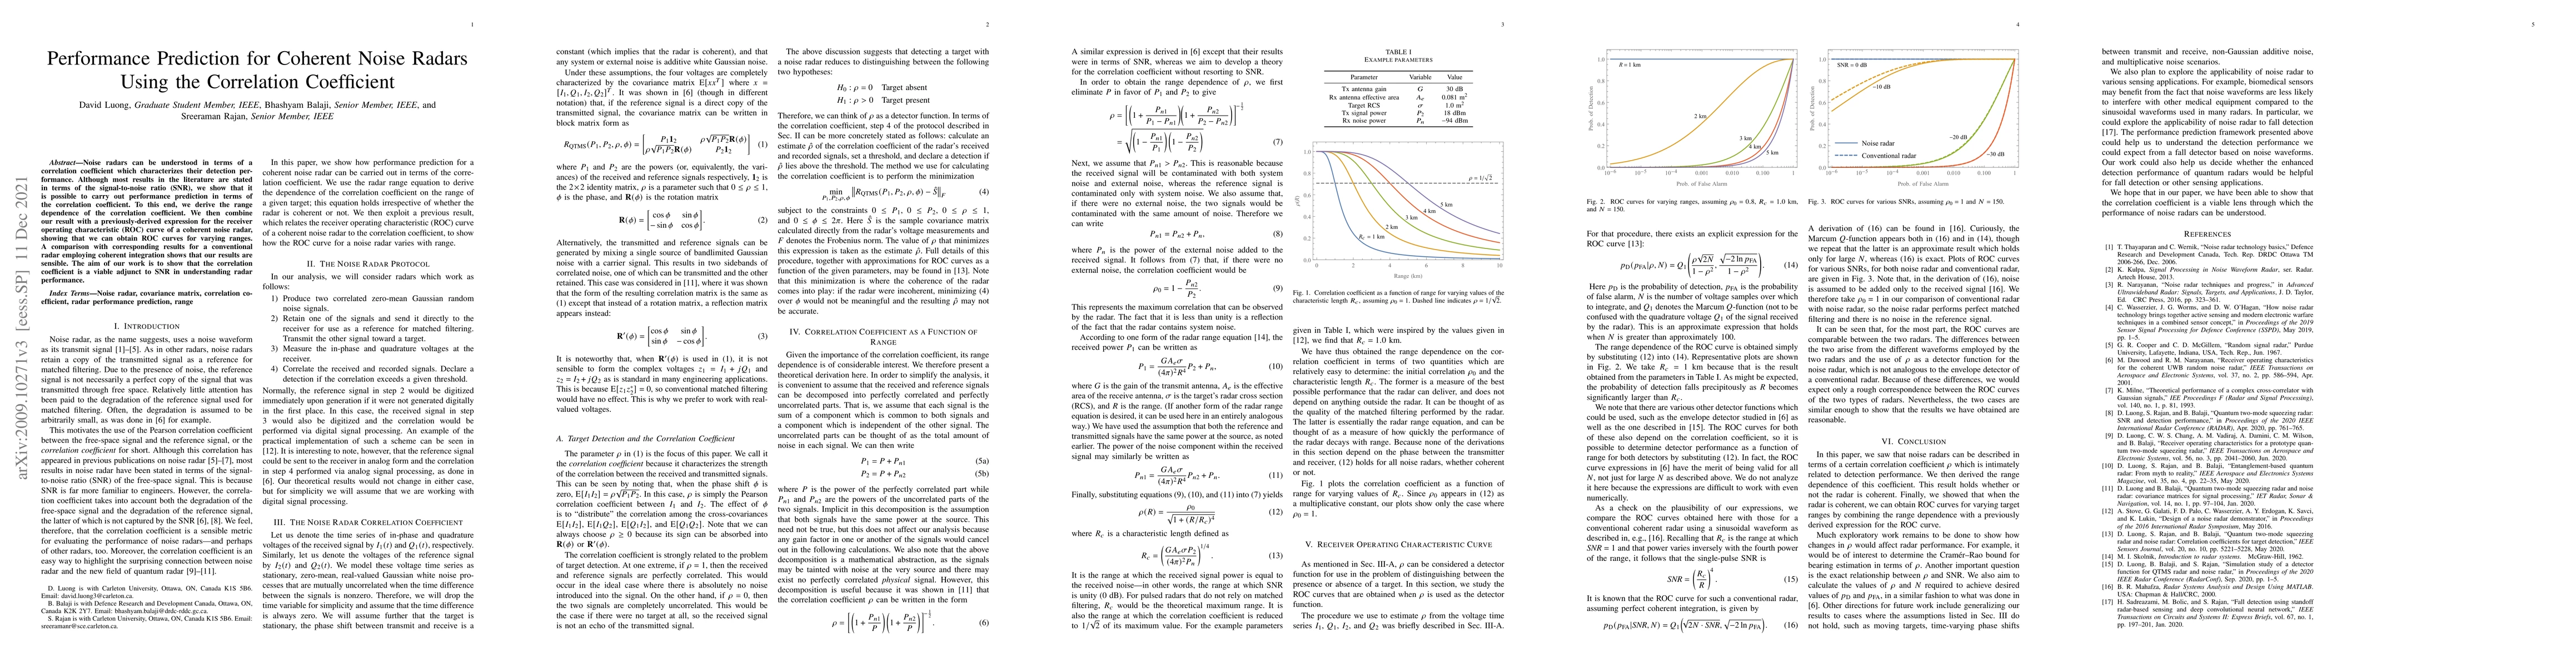
Noise radars can be understood in terms of a correlation coefficient which characterizes their detection performance. Although most results in the literature are stated in terms of the signal-to-noise ratio (SNR), we show that it is possible to carry out performance prediction in terms of the correlation coefficient. To this end, we derive the range dependence of the correlation coefficient. We then combine our result with a previously-derived expression for the receiver operating characteristic (ROC) curve of a coherent noise radar, showing that we can obtain ROC curves for varying ranges. A comparison with corresponding results for a conventional radar employing coherent integration shows that our results are sensible. The aim of our work is to show that the correlation coefficient is a viable adjunct to SNR in understanding radar performance.
AI Key Findings
Get AI-generated insights about this paper's methodology, results, significance, and more — seven facets brought into focus.
Impact
Paper Details
Authors
PDF Preview
Key Terms
Citation Network
Current paper (gray), citations (green), references (blue)
Display is limited for performance on very large graphs.
Discussion 0