Authors
Summary
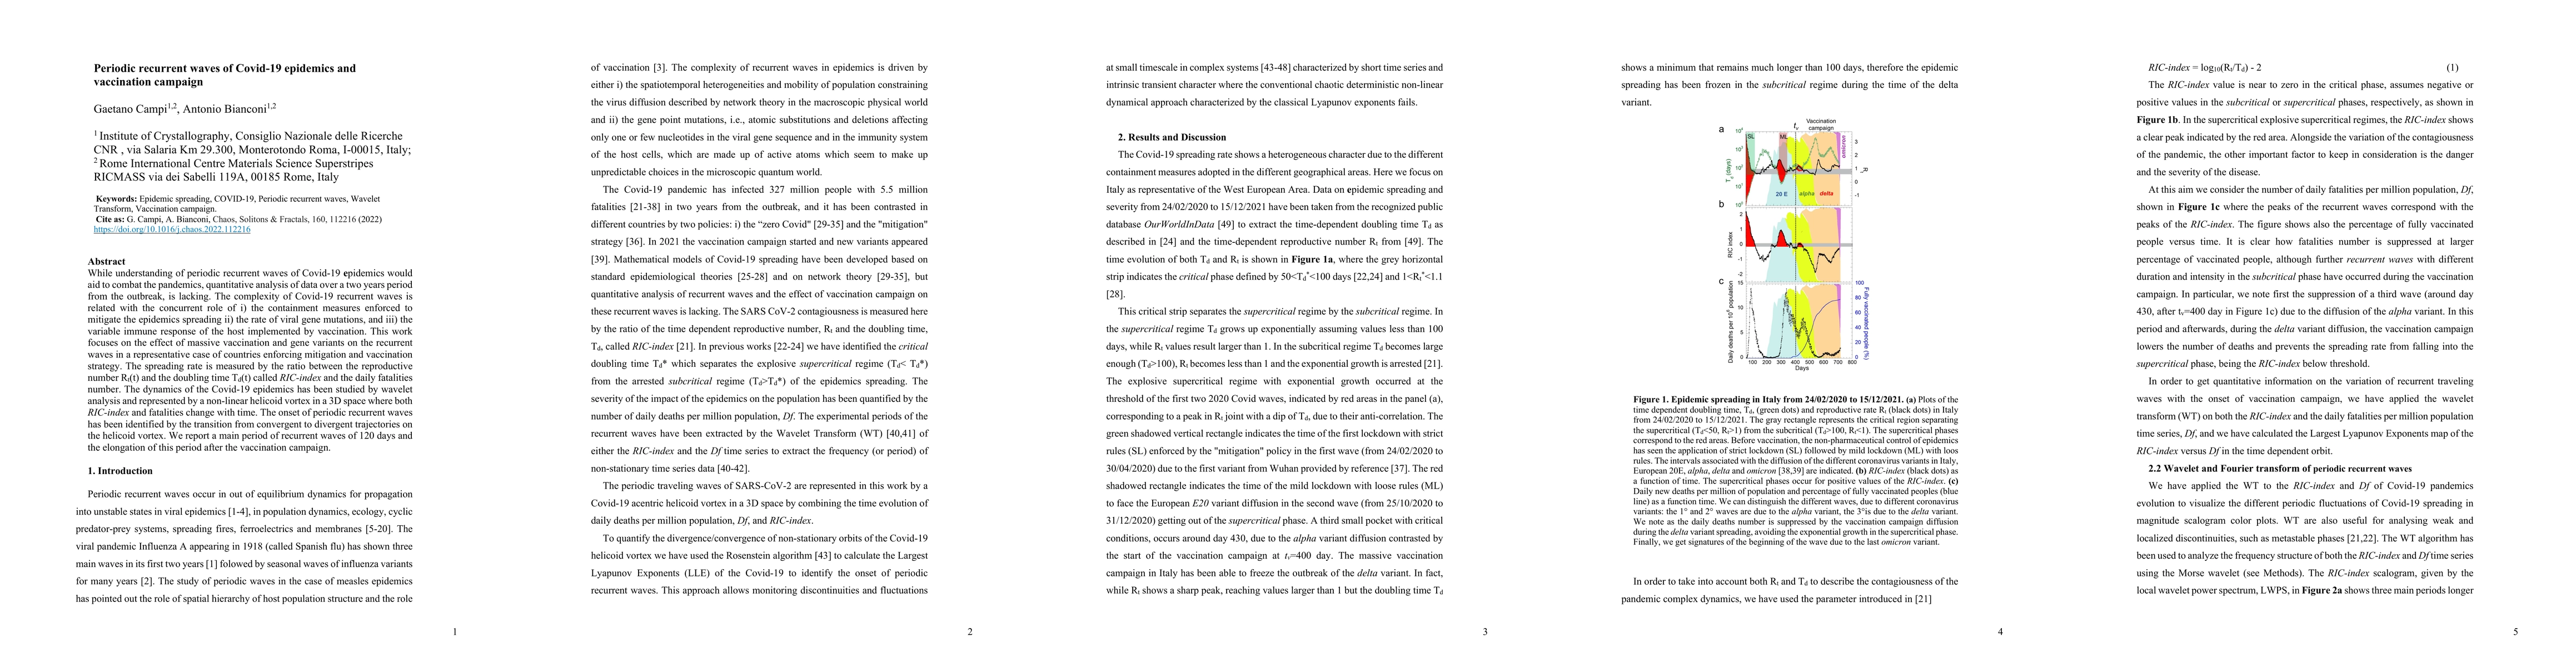
While understanding of periodic recurrent waves of Covid-19 epidemics would aid to combat the pandemics, quantitative analysis of data over a two years period from the outbreak, is lacking. The complexity of Covid-19 recurrent waves is related with the concurrent role of i) the containment measures enforced to mitigate the epidemics spreading ii) the rate of viral gene mutations, and iii) the variable immune response of the host implemented by vaccination. This work focuses on the effect of massive vaccination and gene variants on the recurrent waves in a representative case of countries enforcing mitigation and vaccination strategy. The spreading rate is measured by the ratio between the reproductive number Rt(t) and the doubling time Td(t) called RIC-index and the daily fatalities number. The dynamics of the Covid-19 epidemics has been studied by wavelet analysis and represented by a non-linear helicoid vortex in a 3D space where both RIC-index and fatalities change with time. The onset of periodic recurrent waves has been identified by the transition from convergent to divergent trajectories on the helicoid vortex. We report a main period of recurrent waves of 120 days and the elongation of this period after the vaccination campaign
AI Key Findings
Get AI-generated insights about this paper's methodology, results, and significance.
Paper Details
PDF Preview
Key Terms
Citation Network
Current paper (gray), citations (green), references (blue)
Display is limited for performance on very large graphs.
Similar Papers
Found 4 papersModeling the effect of the vaccination campaign on the Covid-19 pandemic
Efthimios Kaxiras, Mattia Angeli, Marios Mattheakis et al.
Modelling the COVID-19 epidemic and the vaccination campaign in Italy by the SUIHTER model
Luca Dede', Alfio Quarteroni, Nicola Parolini et al.
School-age Vaccination, School Openings and Covid-19 diffusion
Michele Battisti, Giuseppe Maggio, Andrea Mario Lavezzi et al.
| Title | Authors | Year | Actions |
|---|
Comments (0)