Publication
Metrics
AI Quick Summary
This paper explores the concept of periodicity intensity to analyze time series data, demonstrating its application in three distinct use cases: tracking herd movements of newborn calves, assessing wellness in older adults via in-home sensor data, and monitoring the weekly learning behavior of university students in a virtual learning environment. The findings highlight how periodicity intensity provides unique insights into the underlying patterns of these time series.
Paper Preview
Abstract
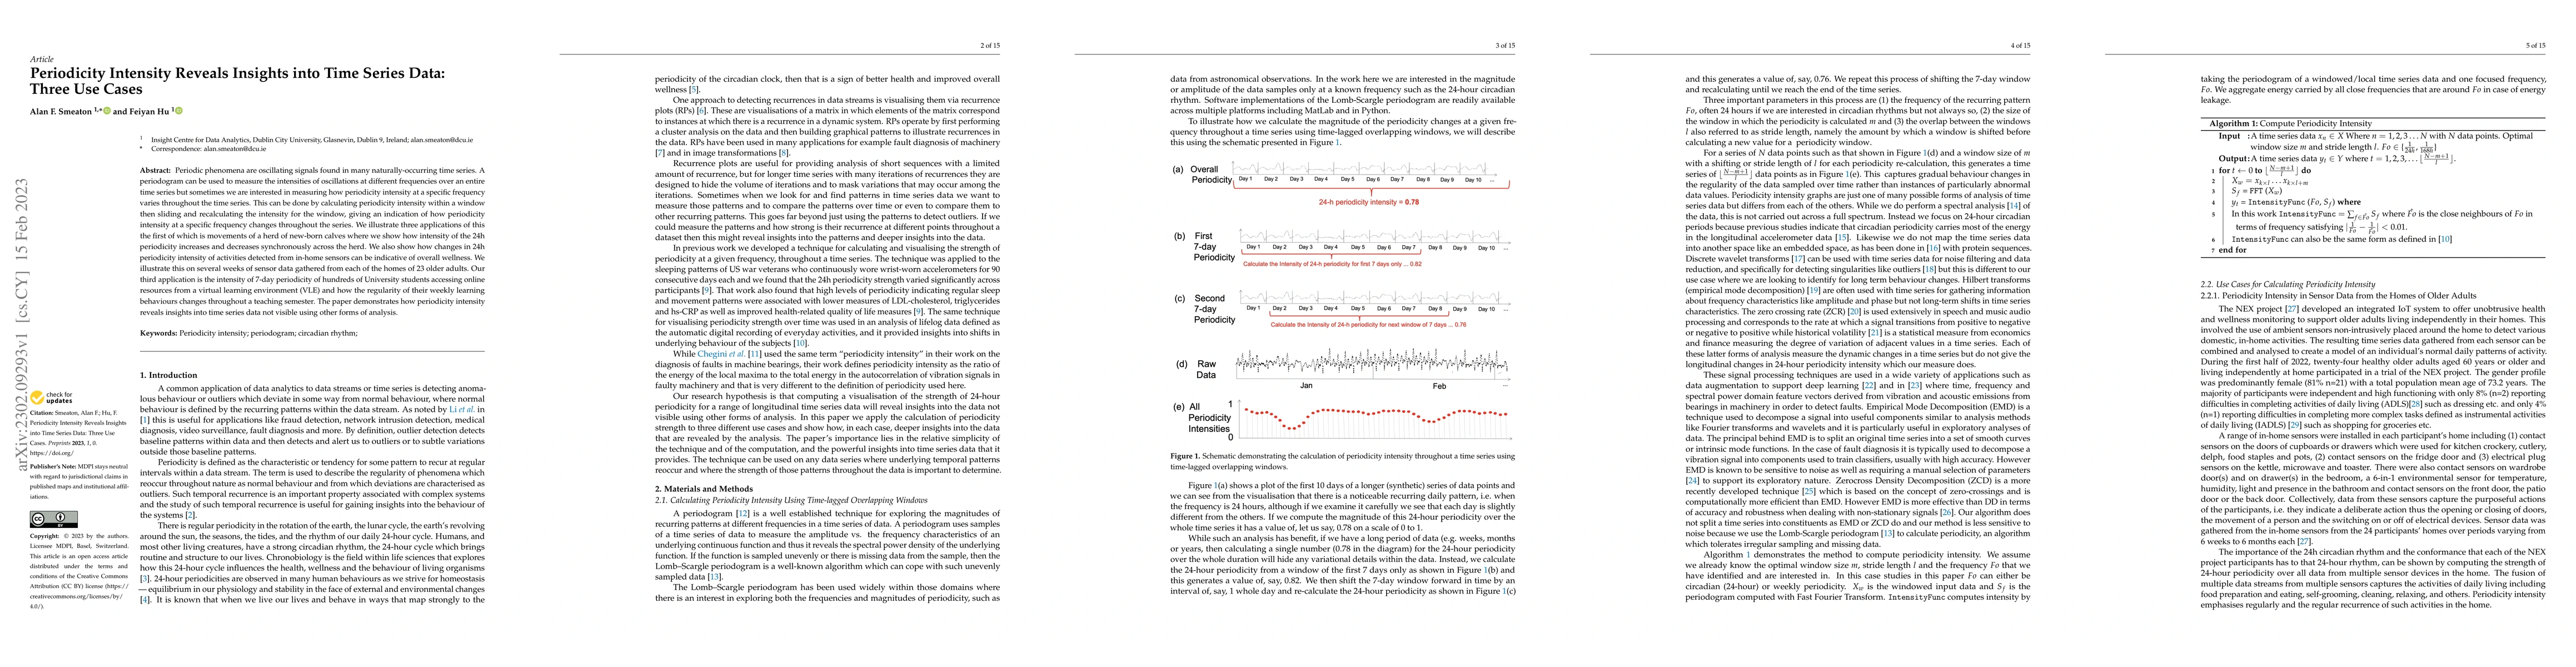
Periodic phenomena are oscillating signals found in many naturally-occurring time series. A periodogram can be used to measure the intensities of oscillations at different frequencies over an entire time series but sometimes we are interested in measuring how periodicity intensity at a specific frequency varies throughout the time series. This can be done by calculating periodicity intensity within a window then sliding and recalculating the intensity for the window, giving an indication of how periodicity intensity at a specific frequency changes throughout the series. We illustrate three applications of this the first of which is movements of a herd of new-born calves where we show how intensity of the 24h periodicity increases and decreases synchronously across the herd. We also show how changes in 24h periodicity intensity of activities detected from in-home sensors can be indicative of overall wellness. We illustrate this on several weeks of sensor data gathered from each of the homes of 23 older adults. Our third application is the intensity of 7-day periodicity of hundreds of University students accessing online resources from a virtual learning environment (VLE) and how the regularity of their weekly learning behaviours changes throughout a teaching semester. The paper demonstrates how periodicity intensity reveals insights into time series data not visible using other forms of analysis
AI Key Findings
Get AI-generated insights about this paper's methodology, results, significance, and more — seven facets brought into focus.
Impact
Paper Details
Authors
PDF Preview
Key Terms
Citation Network
Current paper (gray), citations (green), references (blue)
Display is limited for performance on very large graphs.
Discussion 0