Permutation Entropy for Graph Signals

Source: ArXiv

AI Quick Summary

This paper introduces a novel permutation entropy metric for graph signals, generalizing the established permutation entropy for time series. The algorithm compares signal values on neighboring nodes using the adjacency matrix, preserving classical permutation properties and enabling application to any graph structure.

Share: Share on X LinkedIn

Summary

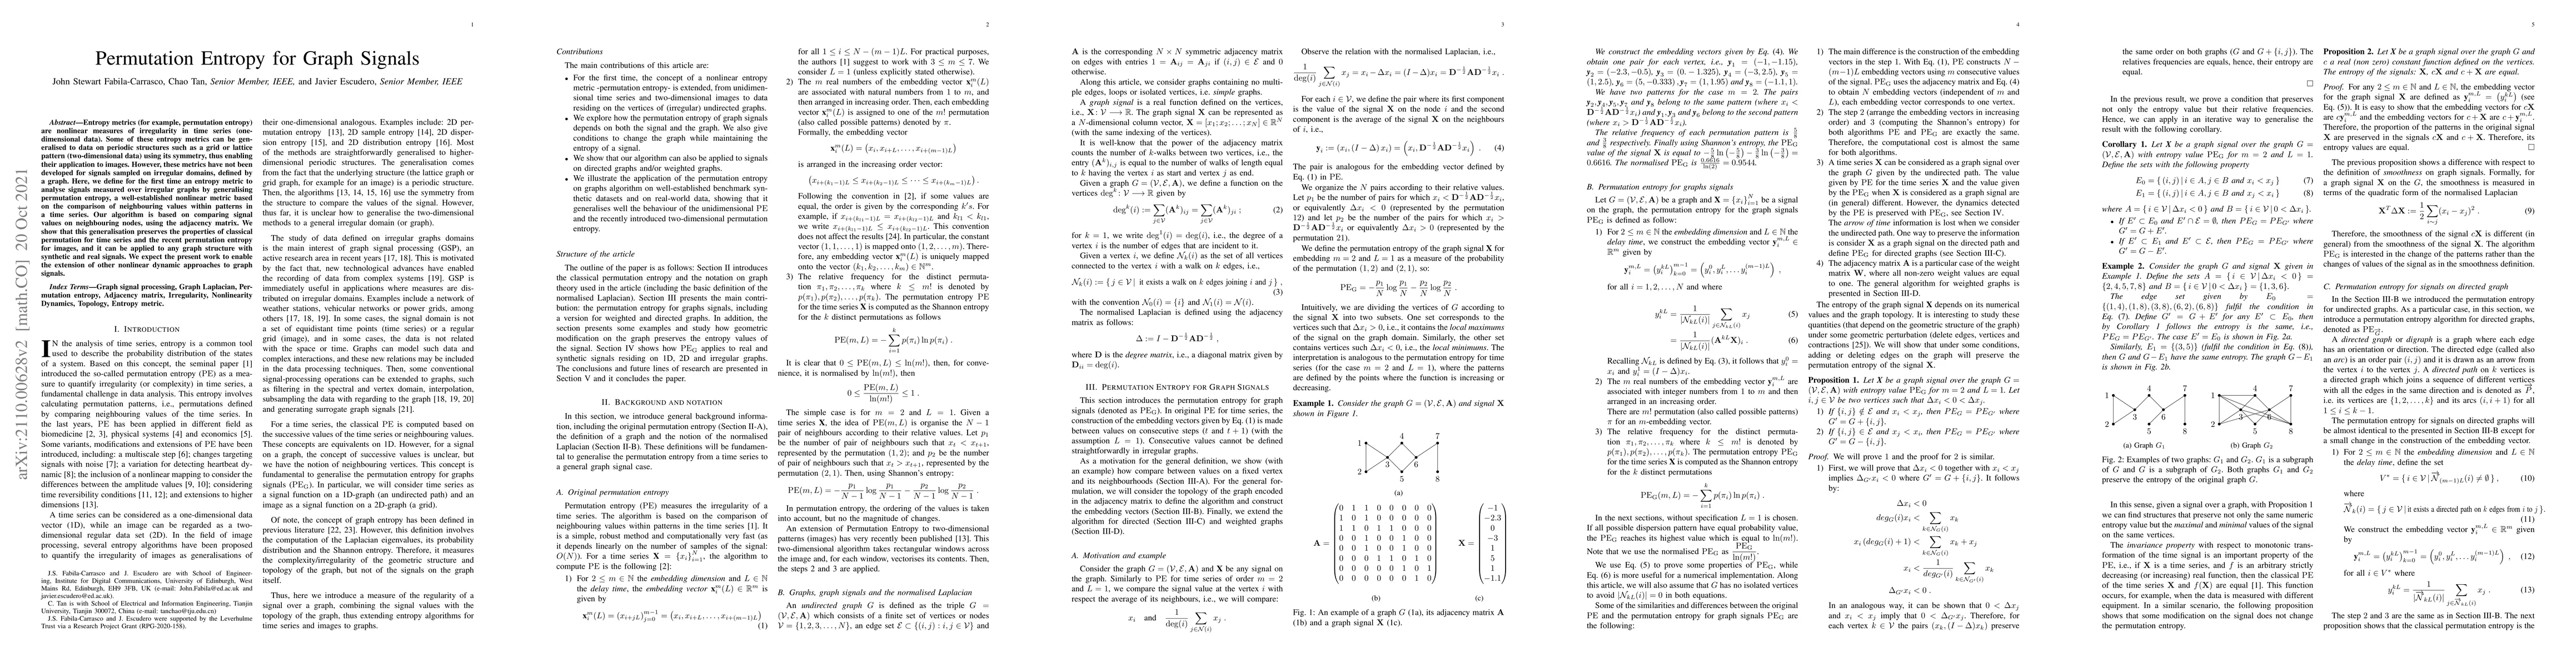
Entropy metrics (for example, permutation entropy) are nonlinear measures of irregularity in time series (one-dimensional data). Some of these entropy metrics can be generalised to data on periodic structures such as a grid or lattice pattern (two-dimensional data) using its symmetry, thus enabling their application to images. However, these metrics have not been developed for signals sampled on irregular domains, defined by a graph. Here, we define for the first time an entropy metric to analyse signals measured over irregular graphs by generalising permutation entropy, a well-established nonlinear metric based on the comparison of neighbouring values within patterns in a time series. Our algorithm is based on comparing signal values on neighbouring nodes, using the adjacency matrix. We show that this generalisation preserves the properties of classical permutation for time series and the recent permutation entropy for images, and it can be applied to any graph structure with synthetic and real signals. We expect the present work to enable the extension of other nonlinear dynamic approaches to graph signals.

AI Key Findings

Generated Sep 02, 2025

Methodology

The research generalizes permutation entropy for graph signals, introducing Permutation Entropy for Graph Signals (PEG) by comparing signal values on neighboring nodes using the adjacency matrix, preserving properties of classical permutation entropy for time series and recent permutation entropy for images.

Key Results

  • PEG preserves properties of classical permutation entropy and recent permutation entropy for images, applicable to any graph structure with synthetic and real signals.
  • PEG detects dynamics in synthetic signals (logistic map, autoregressive models) and real signals (fantasy dataset) with slight variations compared to time series analysis.
  • PEG provides similar results to two-dimensional permutation entropy for images.
  • PEG can distinguish different regularity degrees of graph structures, with entropy values decreasing as the degree of regularity increases.
  • PEG can detect different connectivity degrees in Erdős–Rényi random graph models, where smaller p implies less connectivity and larger entropy.

Significance

This research enables the extension of nonlinear dynamic approaches to graph signals, providing a metric for analyzing the regularity/complexity of signals on irregular domains defined by graphs.

Technical Contribution

PEG, an entropy metric for signals on irregular graphs generalizing permutation entropy, using adjacency matrices to compare neighboring signal values.

Novelty

First entropy metric for signals on general irregular graphs, preserving properties of classical and image-based permutation entropy, applicable to both synthetic and real signals.

Limitations

  • The computational cost is almost the same as classical permutation entropy due to similar steps in pattern arrangement and Shannon entropy computation.
  • Sensitivity to the choice of underlying graph structure and its impact on entropy measure.
  • Limited to graph signals with numerical values and graph topology dependencies.

Future Work

  • Extend other one-dimensional entropy metrics to irregular domains.
  • Generate surrogate graph signals and test their nonlinearity.
  • Study the relationship between graph properties (e.g., graph Laplacian spectrum) and signal regularity.
  • Optimize graph construction for entropy analysis based on given signal characteristics.

Paper Details

PDF Preview

Download PDF

Key Terms

permutation (0.326)
entropy (0.288)
entropy (0.269)
time series (0.261)
signals (0.246)
time series (0.238)
signals (0.233)
irregular (0.220)

Citation Network

Current paper (gray), citations (green), references (blue)

Display is limited for performance on very large graphs.

Current Paper
Citations
References
Click to view
Title Authors Year Actions

Comments (0)

This website uses cookies to ensure you get the best experience. Learn more