Summary
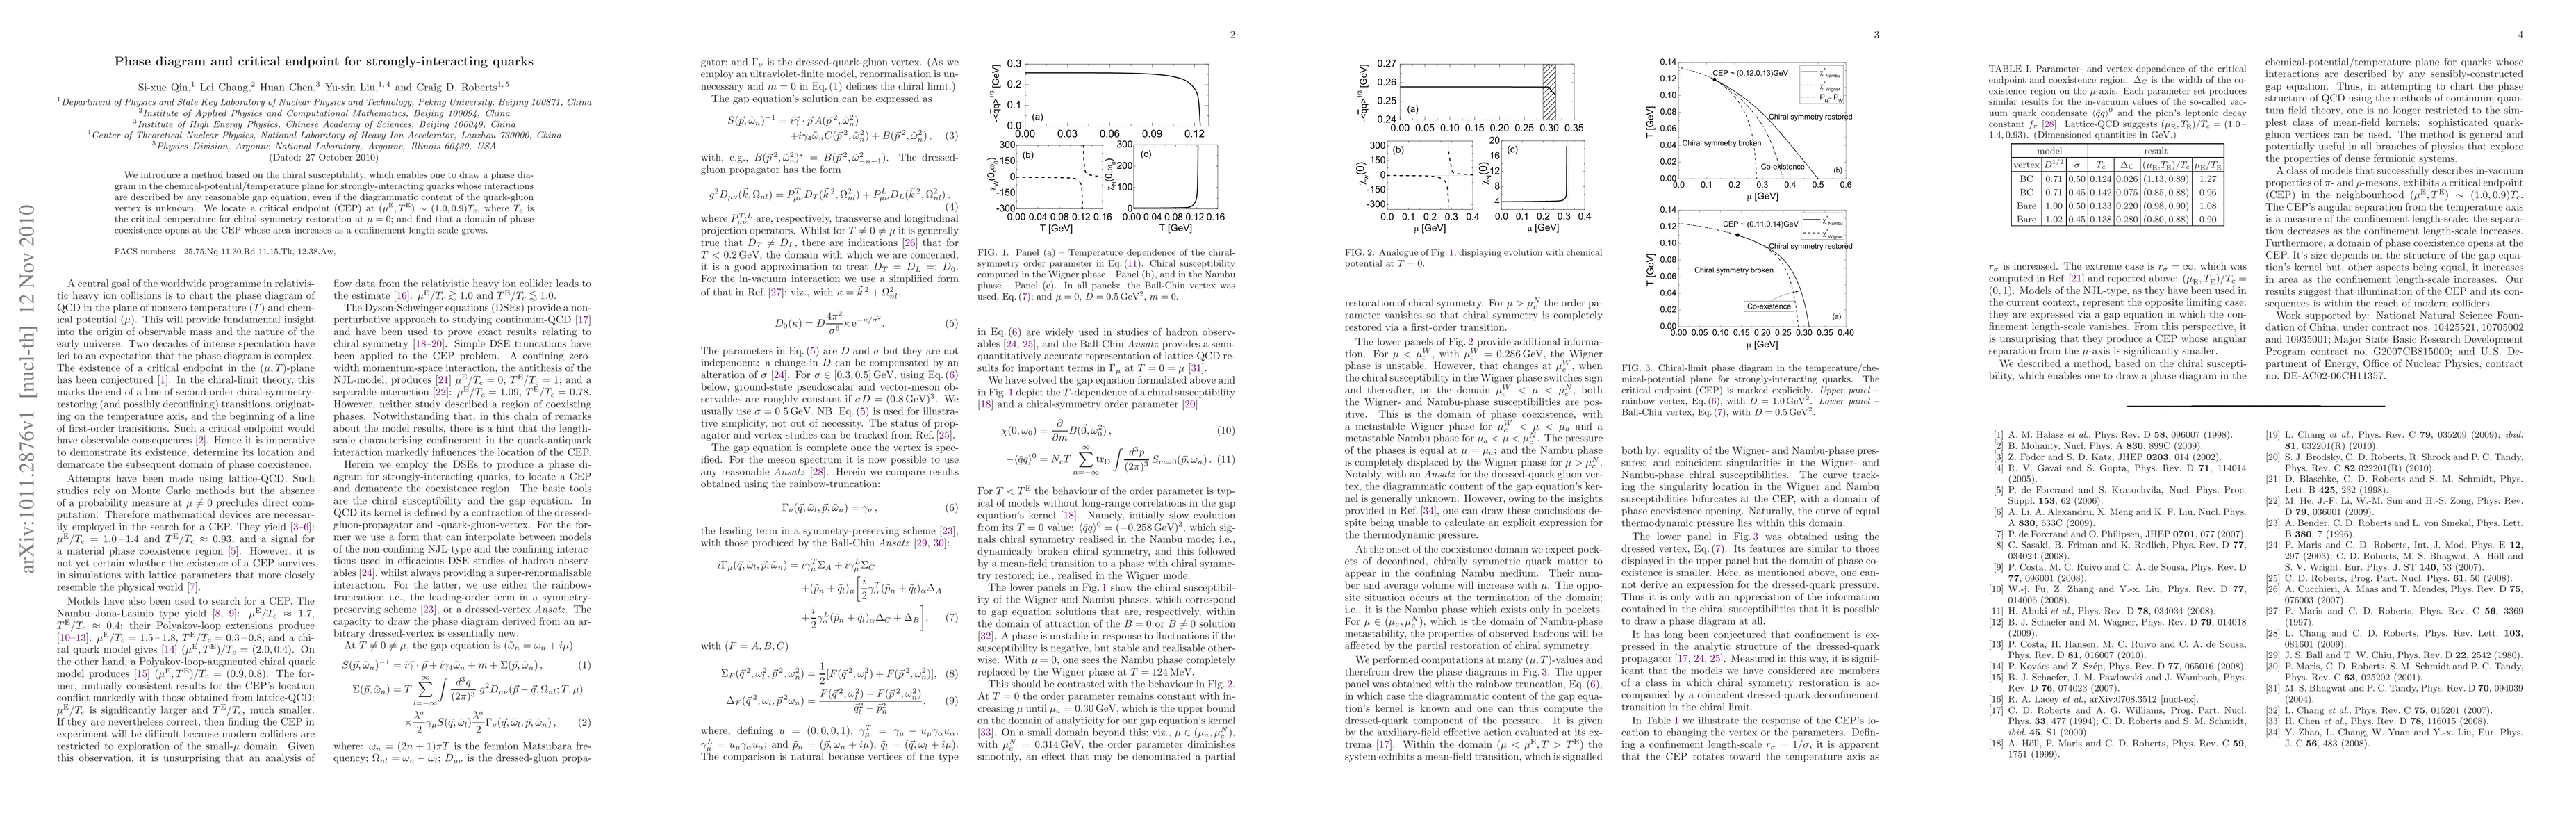
We introduce a method based on the chiral susceptibility, which enables one to draw a phase diagram in the chemical-potential/temperature plane for strongly-interacting quarks whose interactions are described by any reasonable gap equation, even if the diagrammatic content of the quark-gluon vertex is unknown. We locate a critical endpoint (CEP) at (\mu^E,T^E) ~ (1.0,0.9)T_c, where T_c is the critical temperature for chiral symmetry restoration at \mu=0; and find that a domain of phase coexistence opens at the CEP whose area increases as a confinement length-scale grows.
AI Key Findings
Get AI-generated insights about this paper's methodology, results, and significance.
Paper Details
PDF Preview
Key Terms
Citation Network
Current paper (gray), citations (green), references (blue)
Display is limited for performance on very large graphs.
Similar Papers
Found 4 papers| Title | Authors | Year | Actions |
|---|
Comments (0)