Phase diagram and isentropic curves from the vector meson extended Polyakov quark meson model
Publication
Metrics
AI Quick Summary
This paper investigates the QCD phase diagram using the vector meson extended Polyakov quark meson model, determining phase boundaries and the critical end point through a $\chi^2$ minimization procedure. It also calculates isentropic curves in the crossover region, showing their similarity to lattice results.
Paper Preview
Abstract
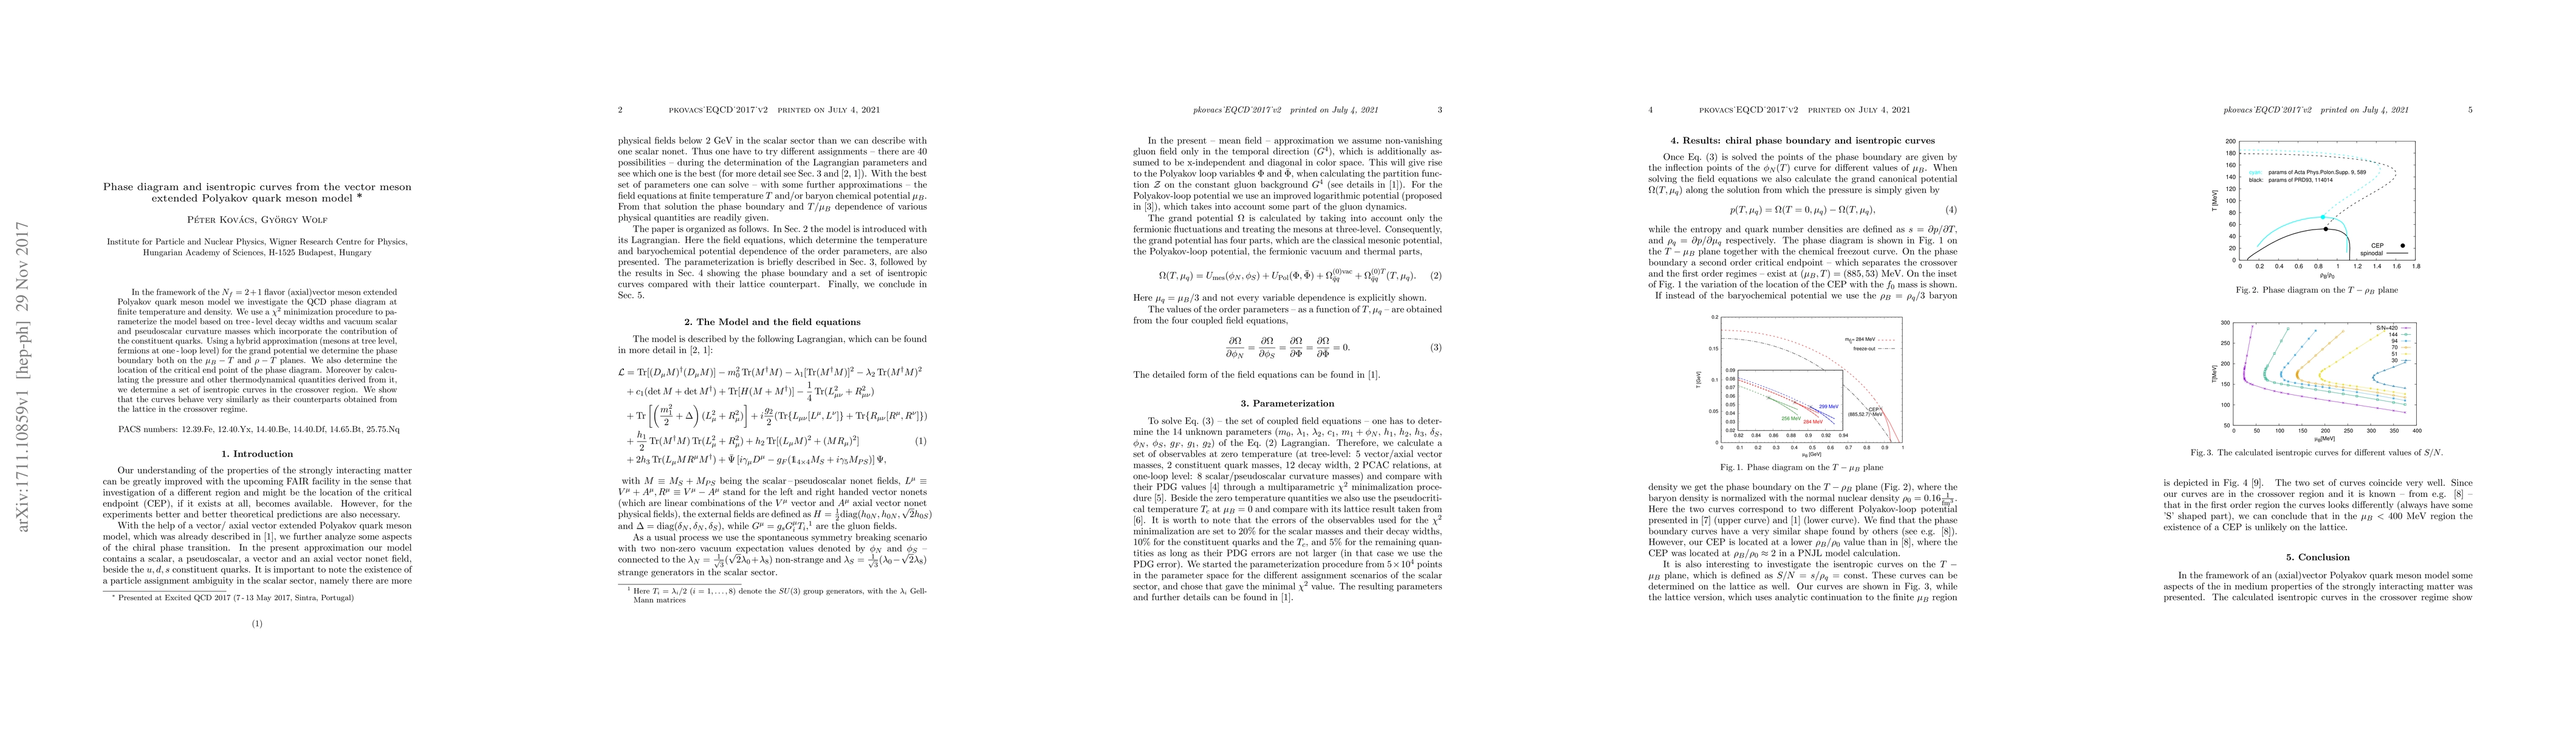
In the framework of the $N_f = 2+1$ flavor (axial)vector meson extended Polyakov quark meson model we investigate the QCD phase diagram at finite temperature and density. We use a $\chi^2$ minimization procedure to parameterize the model based on tree\,-\,level decay widths and vacuum scalar and pseudoscalar curvature masses which incorporate the contribution of the constituent quarks. Using a hybrid approximation (mesons at tree level, fermions at one\,-\,loop level) for the grand potential we determine the phase boundary both on the $\mu_B-T$ and $\rho-T$ planes. We also determine the location of the critical end point of the phase diagram. Moreover by calculating the pressure and other thermodynamical quantities derived from it, we determine a set of isentropic curves in the crossover region. We show that the curves behave very similarly as their counterparts obtained from the lattice in the crossover regime.
AI Key Findings
Get AI-generated insights about this paper's methodology, results, significance, and more — seven facets brought into focus.
Impact
Paper Details
PDF Preview
Key Terms
Citation Network
Current paper (gray), citations (green), references (blue)
Display is limited for performance on very large graphs.
Discussion 0