Publication
Metrics
AI Quick Summary
This paper presents a phase diagram for Nflation, demonstrating a large N phase transition where an increase in the number of fields leads to the disappearance of the slow roll inflation phase. Near the critical point, the number of fields saturates de Sitter (dS) entropy, highlighting relevant results and the entropy bound.
Paper Preview
Abstract
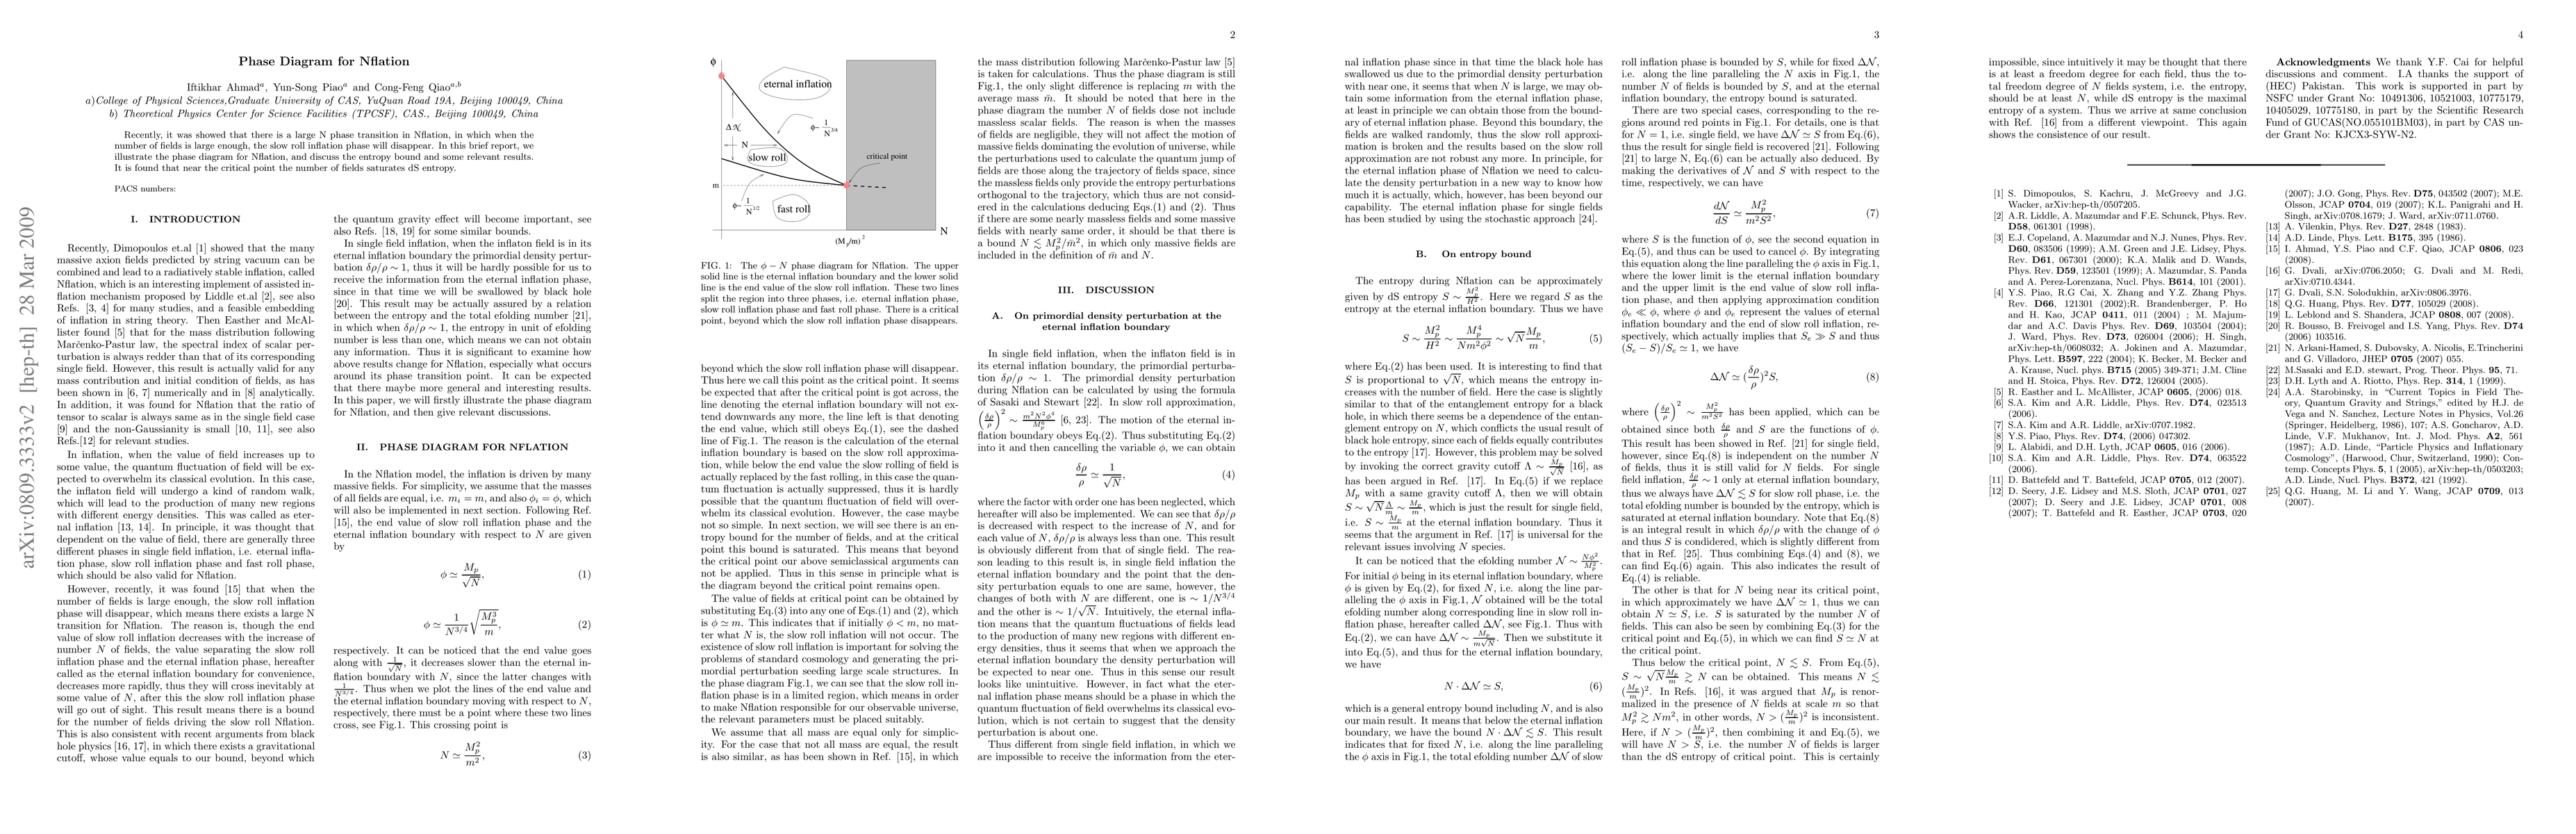
Recently, it was showed that there is a large N phase transition in Nflation, in which when the number of fields is large enough, the slow roll inflation phase will disappear. In this brief report, we illustrate the phase diagram for Nflation, and discuss the entropy bound and some relevant results. It is found that near the critical point the number of fields saturates dS entropy.
AI Key Findings
Get AI-generated insights about this paper's methodology, results, significance, and more — seven facets brought into focus.
Impact
Paper Details
PDF Preview
Key Terms
Citation Network
Current paper (gray), citations (green), references (blue)
Display is limited for performance on very large graphs.
Discussion 0