Publication
Metrics
AI Quick Summary
Researchers studied a system undergoing inverse melting, finding two fluid phases separated by a solid region with decreasing transition temperature as concentration decreases. A first-order phase transition occurs between the fluid phases.
Paper Preview
Abstract
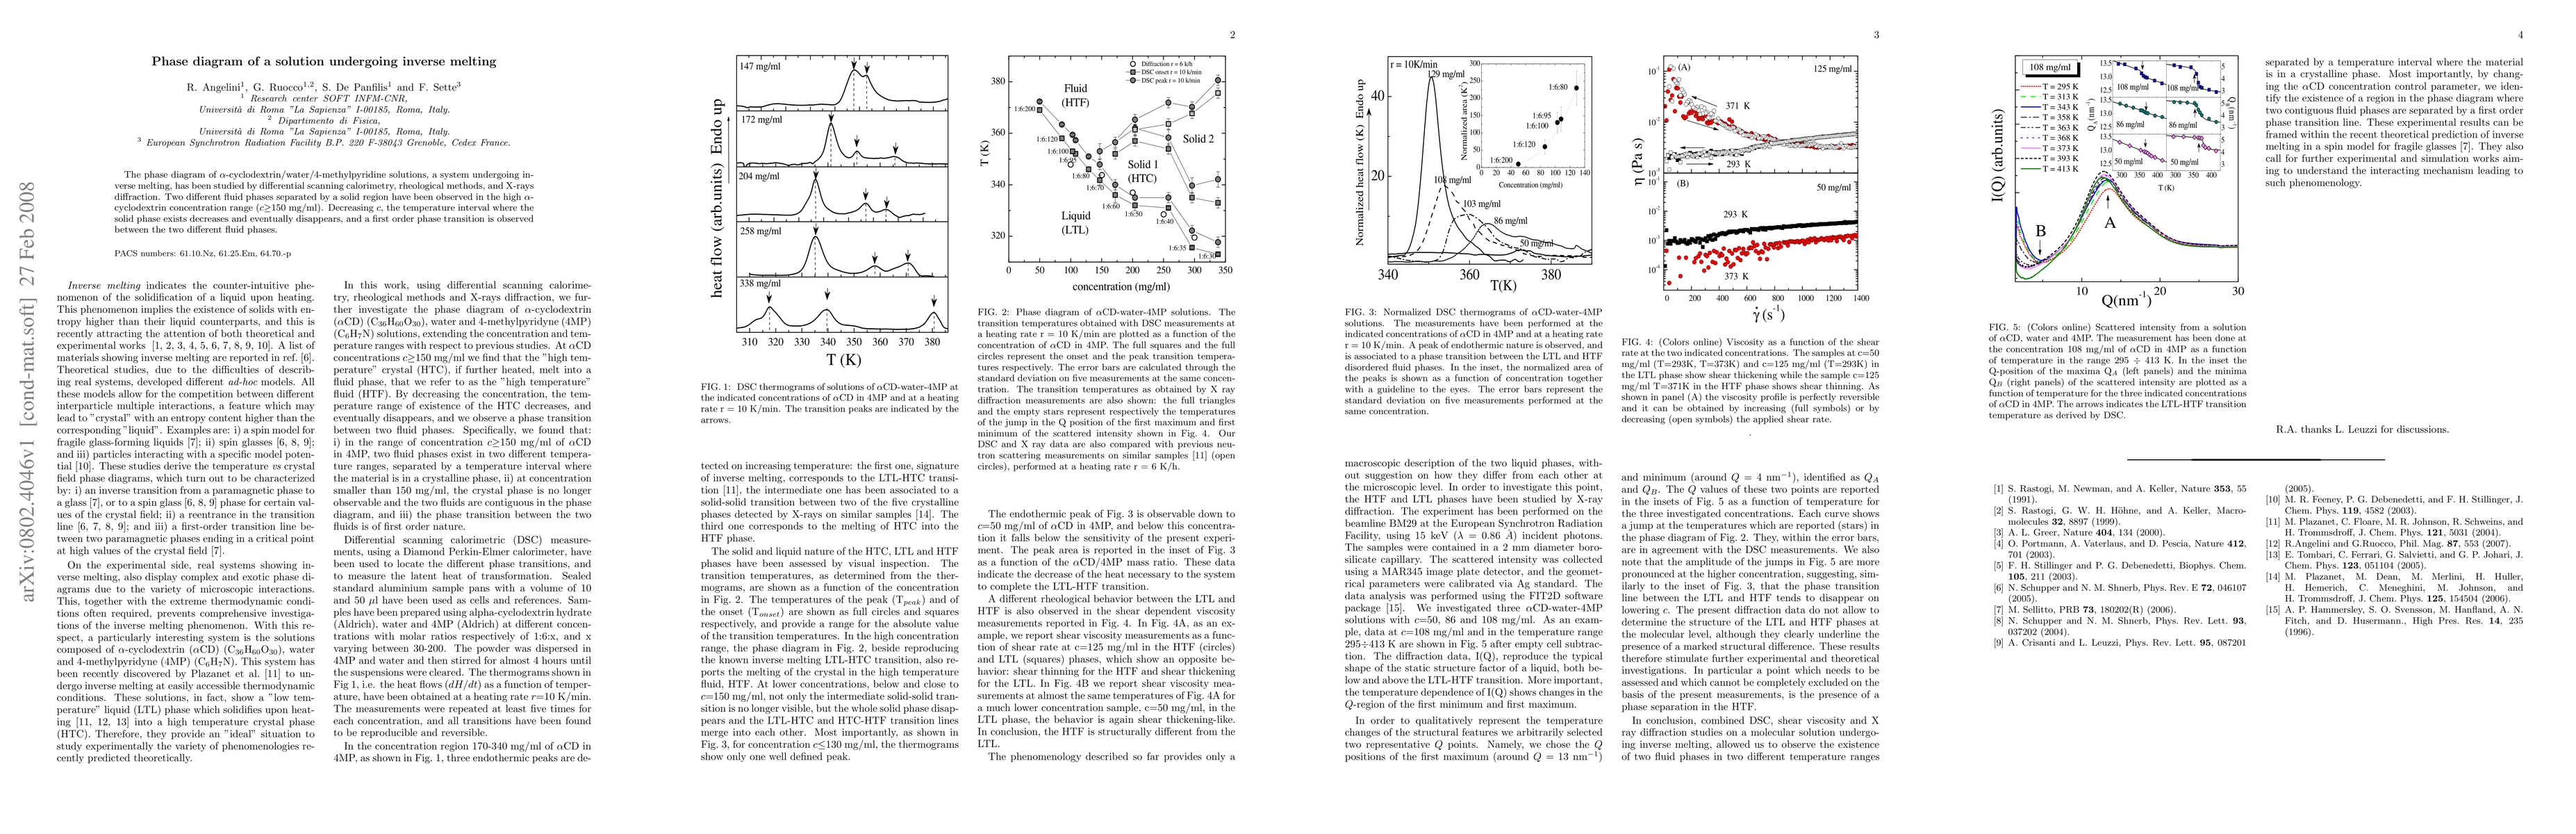
The phase diagram of $\alpha$-cyclodextrin/water/4-methylpyridine solutions, a system undergoing inverse melting, has been studied by differential scanning calorimetry, rheological methods, and X-rays diffraction. Two different fluid phases separated by a solid region have been observed in the high $\alpha$-cyclodextrin concentration range ($c$$\geq$150 mg/ml). Decreasing $c$, the temperature interval where the solid phase exists decreases and eventually disappears, and a first order phase transition is observed between the two different fluid phases.
AI Key Findings
Get AI-generated insights about this paper's methodology, results, significance, and more — seven facets brought into focus.
Impact
Paper Details
PDF Preview
Key Terms
Citation Network
Current paper (gray), citations (green), references (blue)
Display is limited for performance on very large graphs.
Related Papers
No references found for this paper.
Discussion 0