01
MethodologyHow they did it
Brief description of the research methodology used
This research experimentally investigates the phase diagram of spin 1 antiferromagnetic Bose-Einstein condensates, revealing a transition from an antiferromagnetic phase to a broken axisymmetry phase as magnetic fields change, driven by the interplay of spin interactions and Zeeman energy. The findings align well with mean-field theoretical predictions.
This research experimentally investigates the phase diagram of spin 1 antiferromagnetic Bose-Einstein condensates, revealing a transition from an antiferromagnetic phase to a broken axisymmetry phase as magnetic fields change, driven by the interplay of spin interactions and Zeeman energy. The findings align well with mean-field theoretical predictions.
Brief description of the research methodology used More in Methodology →
Main finding 1 — Main finding 2 More in Key Results →
Why this research is important and its potential impact More in Significance →
Limitation 1 — Limitation 2 More in Limitations →
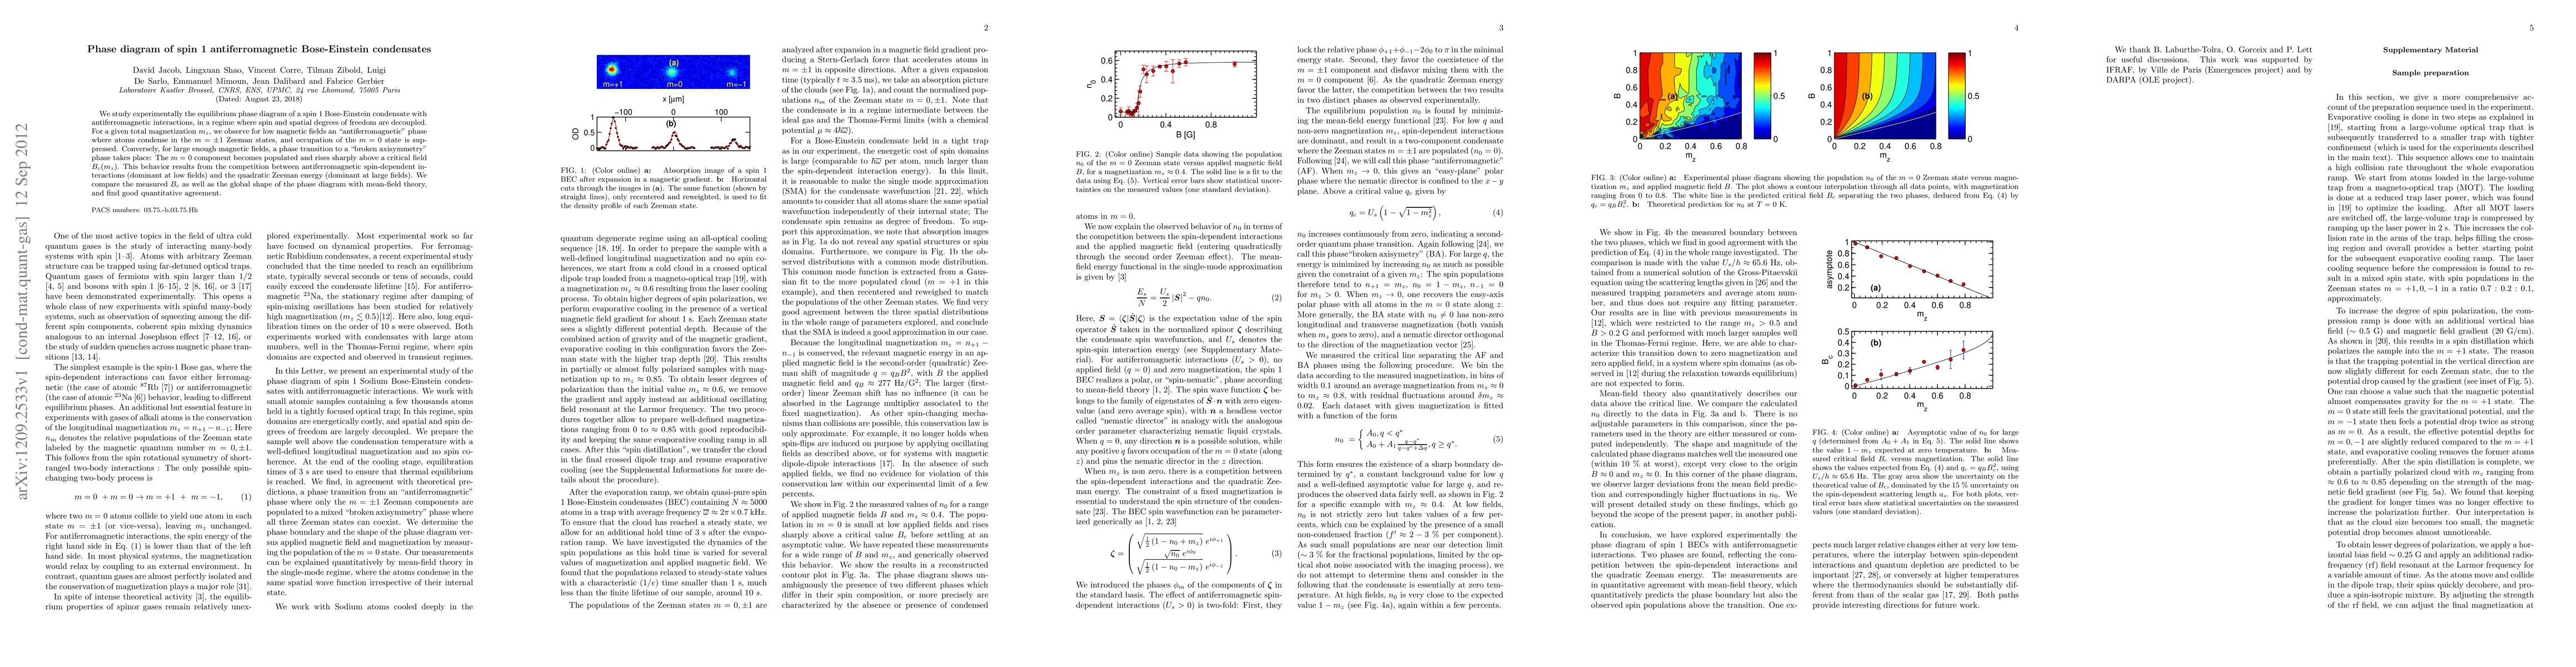
We study experimentally the equilibrium phase diagram of a spin 1 Bose-Einstein condensate with antiferromagnetic interactions, in a regime where spin and spatial degrees of freedom are decoupled. For a given total magnetization mz, we observe for low magnetic fields an "antiferromagnetic" phase where atoms condense in the m=+/-1 Zeeman states, and occupation of the m=0 state is suppressed. Conversely, for large enough magnetic fields, a phase transition to a "broken axisymmetry" phase takes place: The m=0 component becomes populated and rises sharply above a critical field Bc(mz). This behavior results from the competition between antiferromagnetic spin-dependent interactions (dominant at low fields) and the quadratic Zeeman energy (dominant at large fields). We compare the measured Bc as well as the global shape of the phase diagram with mean-field theory, and find good quantitative agreement.
Seven facets of this paper, analysed and brought into focus by AI.
Why this research is important and its potential impact
Brief description of the research methodology used
Why this research is important and its potential impact
Main technical or theoretical contribution
What makes this work novel or different from existing research
Current paper (gray), citations (green), references (blue)
Display is limited for performance on very large graphs.
Discussion 0