Publication
Metrics
AI Quick Summary
This paper presents a phase diagram for different step faceting phases on a crystal surface, calculated using the density matrix renormalization group method. The study reveals two distinct phase transition temperatures, leading to unique anisotropic surface tensions and differing shape exponents for step droplet phases compared to the GMPT model.
Paper Preview
Abstract
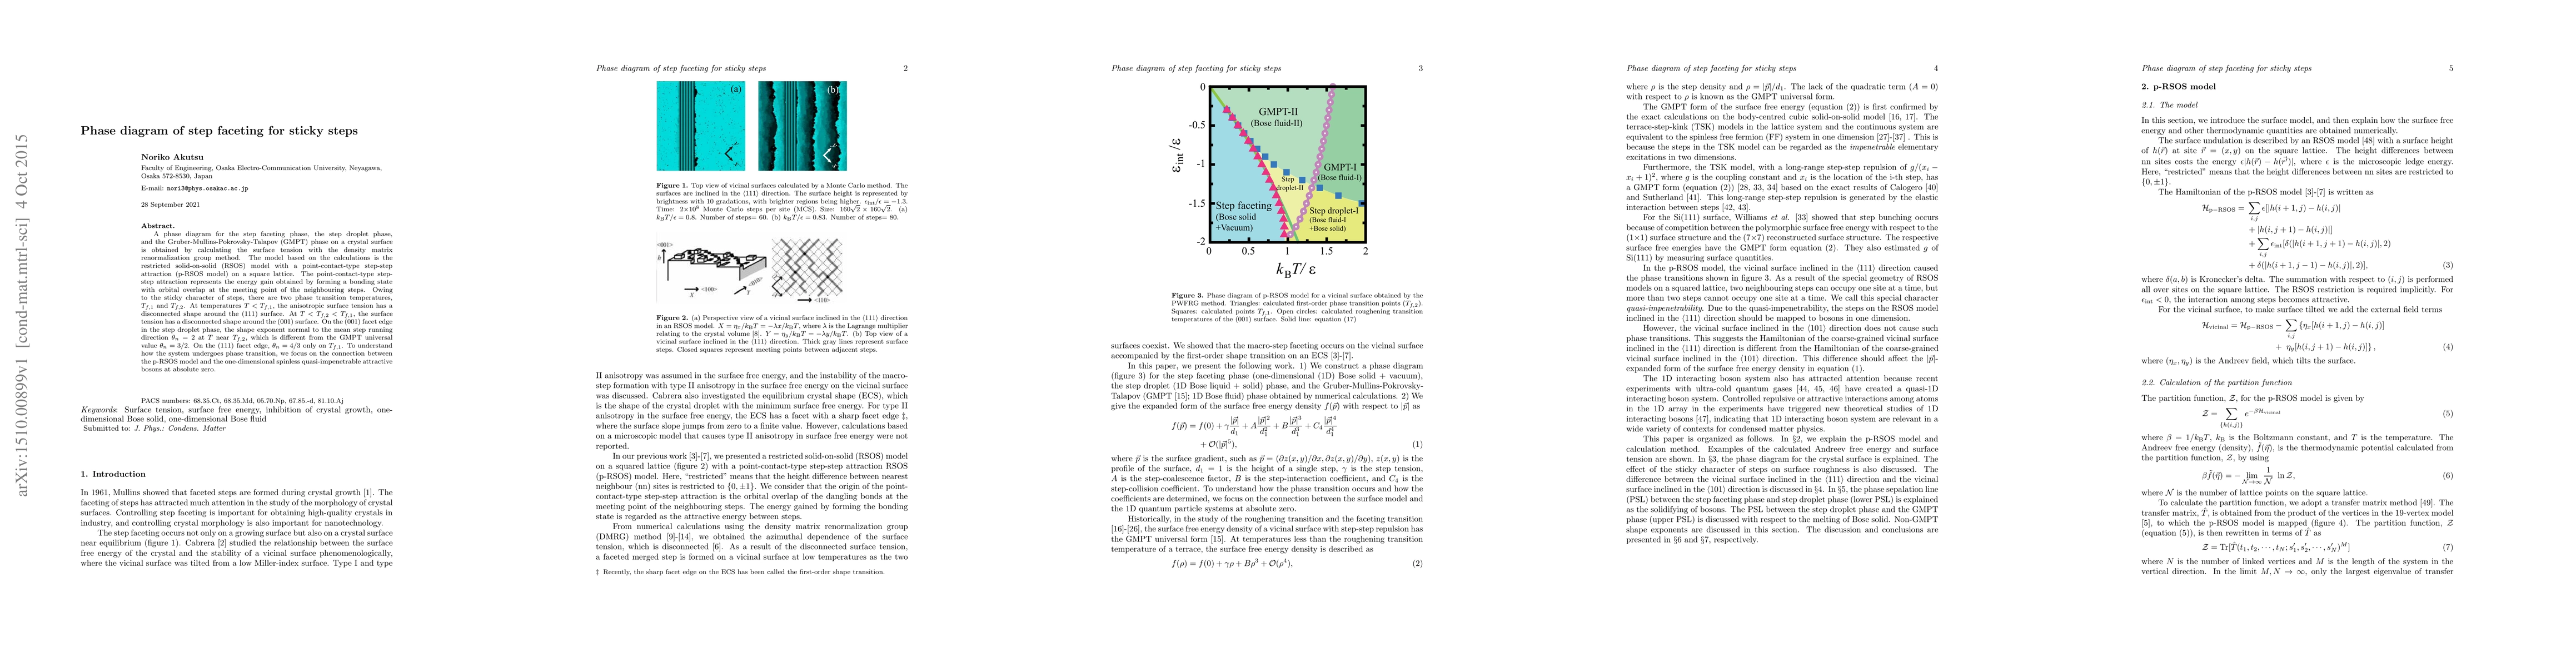
A phase diagram for the step faceting phase, the step droplet phase, and the Gruber-Mullins-Pokrovsky-Talapov (GMPT) phase on a crystal surface is obtained by calculating the surface tension with the density matrix renormalization group method. The model based on the calculations is the restricted solid-on-solid (RSOS) model with a point-contact-type step-step attraction (p-RSOS model) on a square lattice. The point-contact-type step-step attraction represents the energy gain obtained by forming a bonding state with orbital overlap at the meeting point of the neighbouring steps. Owing to the sticky character of steps, there are two phase transition temperatures, $T_{f,1}$ and $T_{f,2}$. At temperatures $T < T_{f,1}$, the anisotropic surface tension has a disconnected shape around the (111) surface. At $T
AI Key Findings
Get AI-generated insights about this paper's methodology, results, significance, and more — seven facets brought into focus.
Impact
Paper Details
PDF Preview
Key Terms
Citation Network
Current paper (gray), citations (green), references (blue)
Display is limited for performance on very large graphs.
Discussion 0