Summary
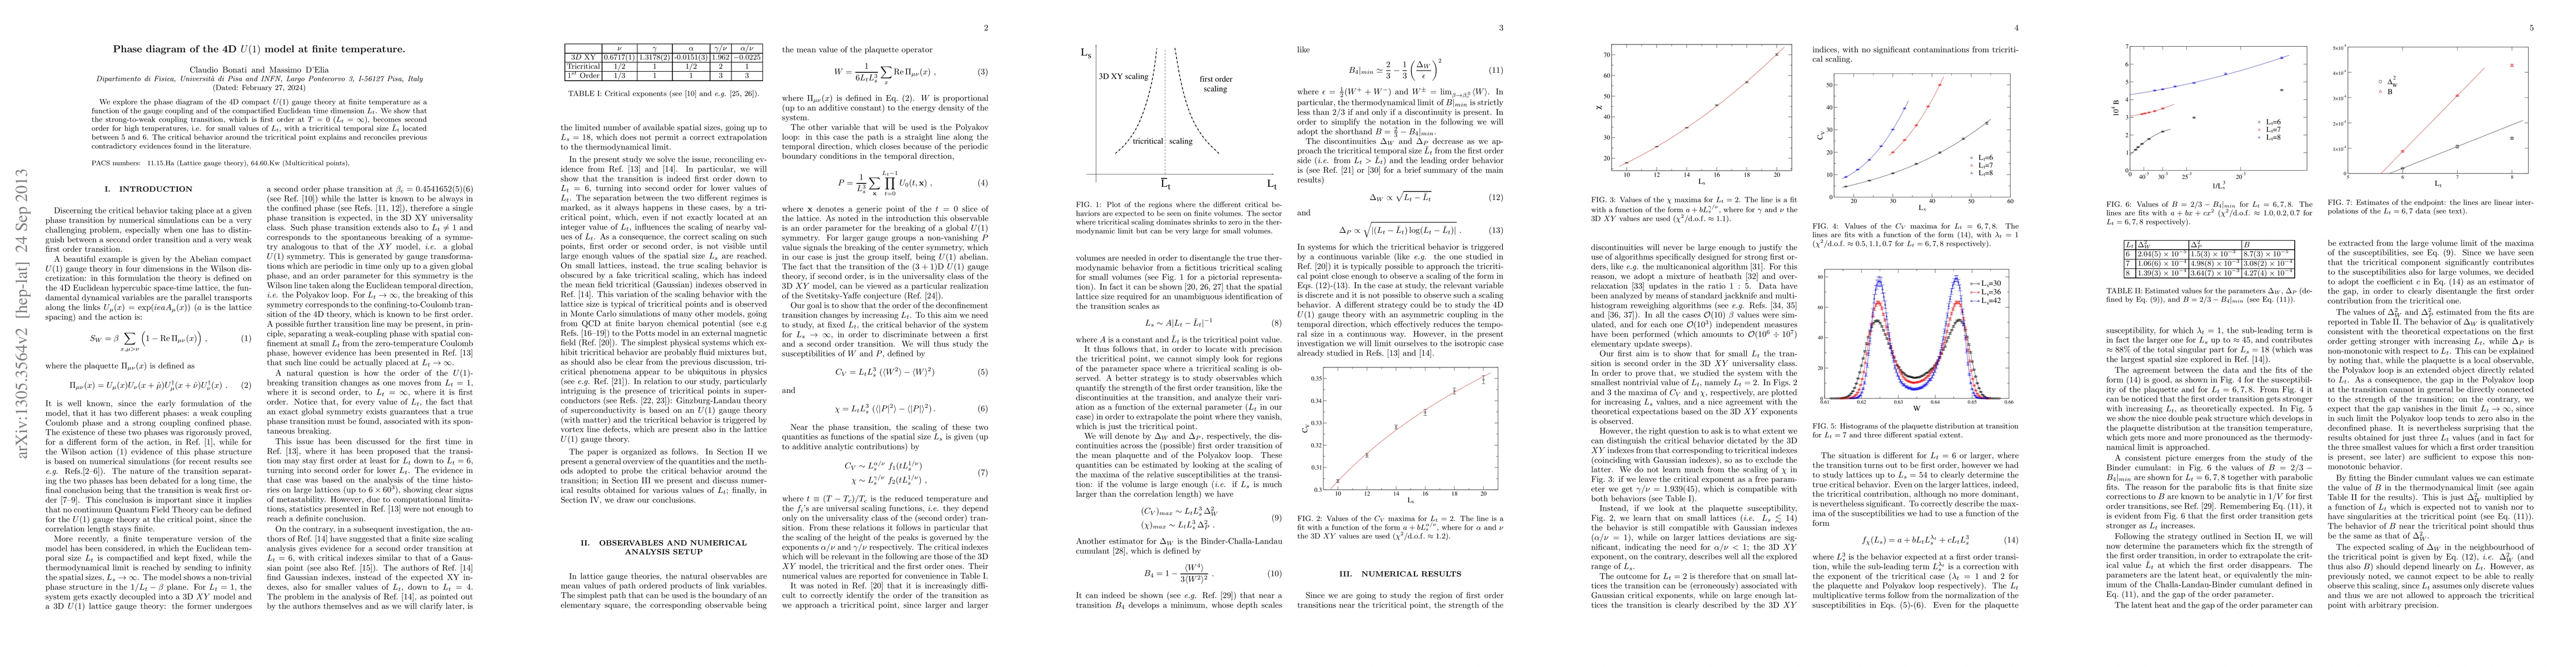
We explore the phase diagram of the 4D compact U(1) gauge theory at finite temperature as a function of the gauge coupling and of the compactified Euclidean time dimension L_t. We show that the strong-to-weak coupling transition, which is first order at T=0 (L_t=\infty), becomes second order for high temperatures, i.e. for small values of L_t, with a tricritical temporal size \bar{L_t} located between 5 and 6. The critical behavior around the tricritical point explains and reconciles previous contradictory evidences found in the literature.
AI Key Findings
Get AI-generated insights about this paper's methodology, results, and significance.
Paper Details
PDF Preview
Key Terms
Citation Network
Current paper (gray), citations (green), references (blue)
Display is limited for performance on very large graphs.
Similar Papers
Found 4 papersNo citations found for this paper.
Comments (0)