Publication
Metrics
AI Quick Summary
This paper establishes a complete phase diagram for the Ashkin-Teller model on the square lattice, confirming long-standing conjectures from the 1970s. It shows distinct transition curves for $J<U$ and a self-dual curve for $J\geq U$, with all transitions proven to be sharp using the OSSS inequality.
Paper Preview
Abstract
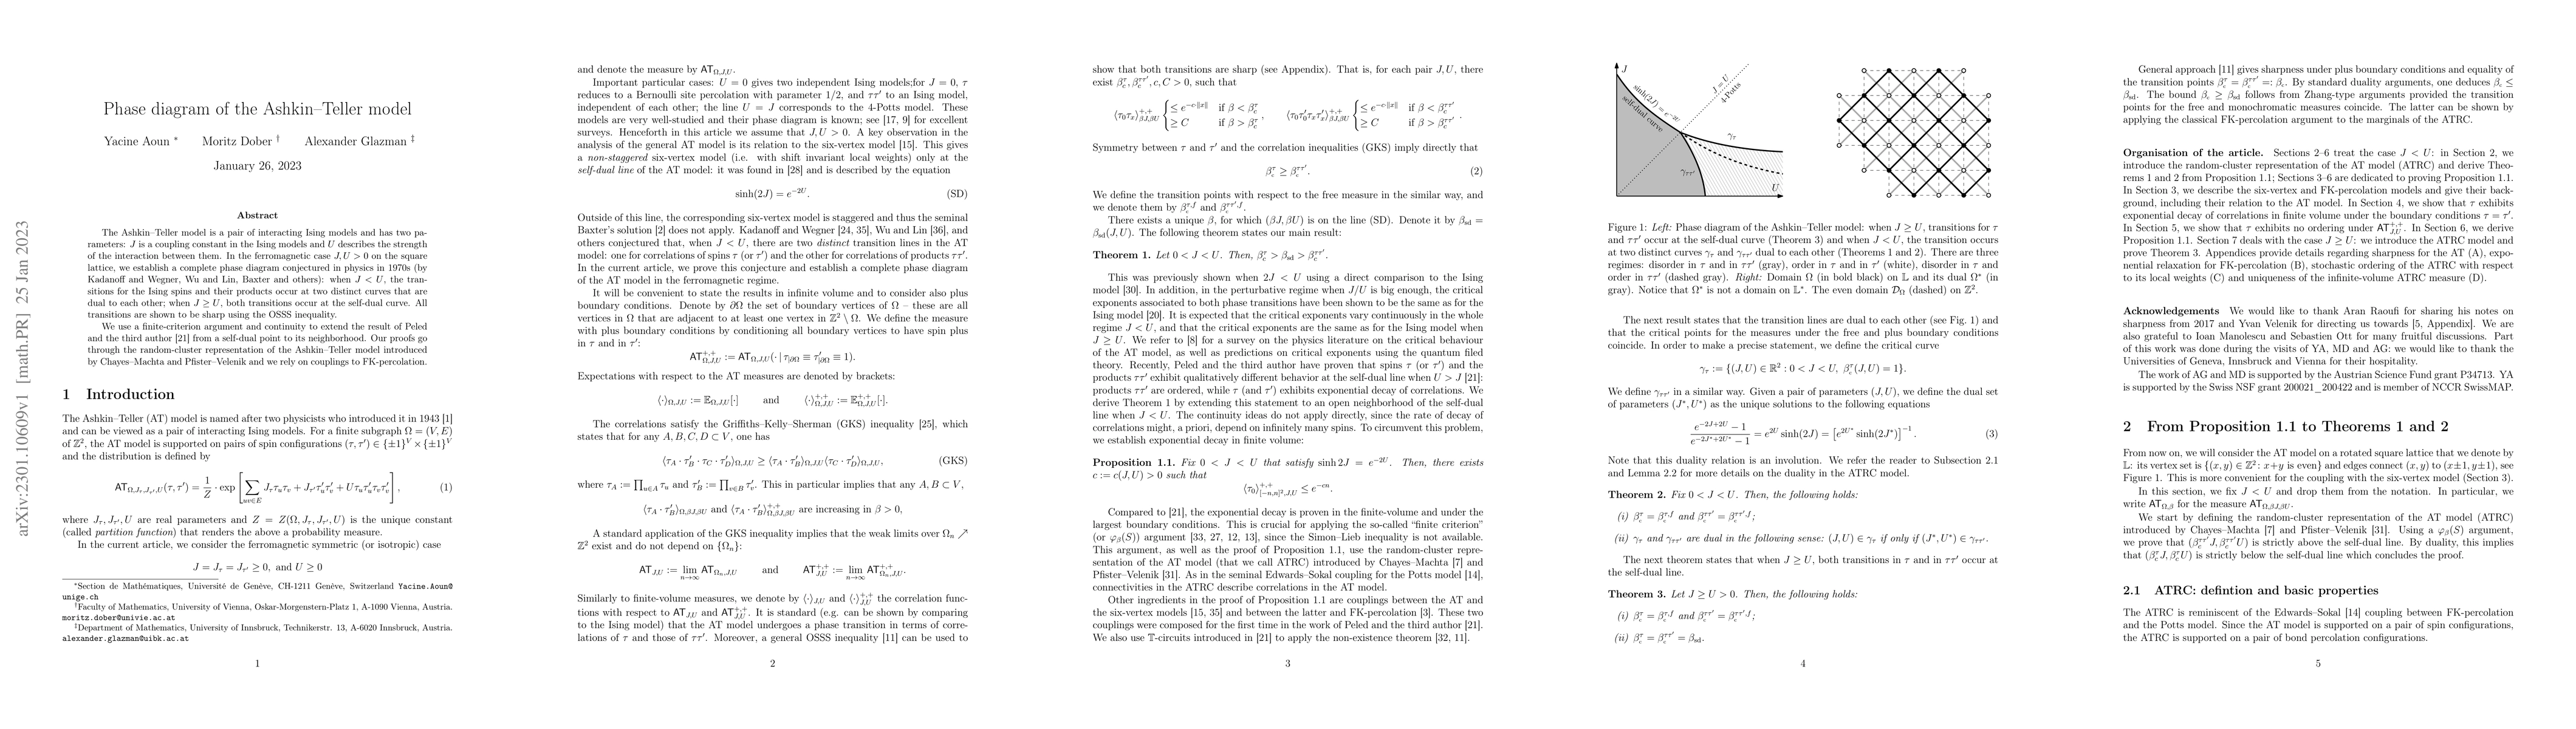
The Ashkin-Teller model is a pair of interacting Ising models and has two parameters: $J$ is a coupling constant in the Ising models and $U$ describes the strength of the interaction between them. In the ferromagnetic case $J,U>0$ on the square lattice, we establish a complete phase diagram conjectured in physics in 1970s (by Kadanoff and Wegner, Wu and Lin, Baxter and others): when $J
AI Key Findings
Get AI-generated insights about this paper's methodology, results, significance, and more — seven facets brought into focus.
Impact
Paper Details
Authors
PDF Preview
Key Terms
Citation Network
Current paper (gray), citations (green), references (blue)
Display is limited for performance on very large graphs.
Discussion 0