Summary
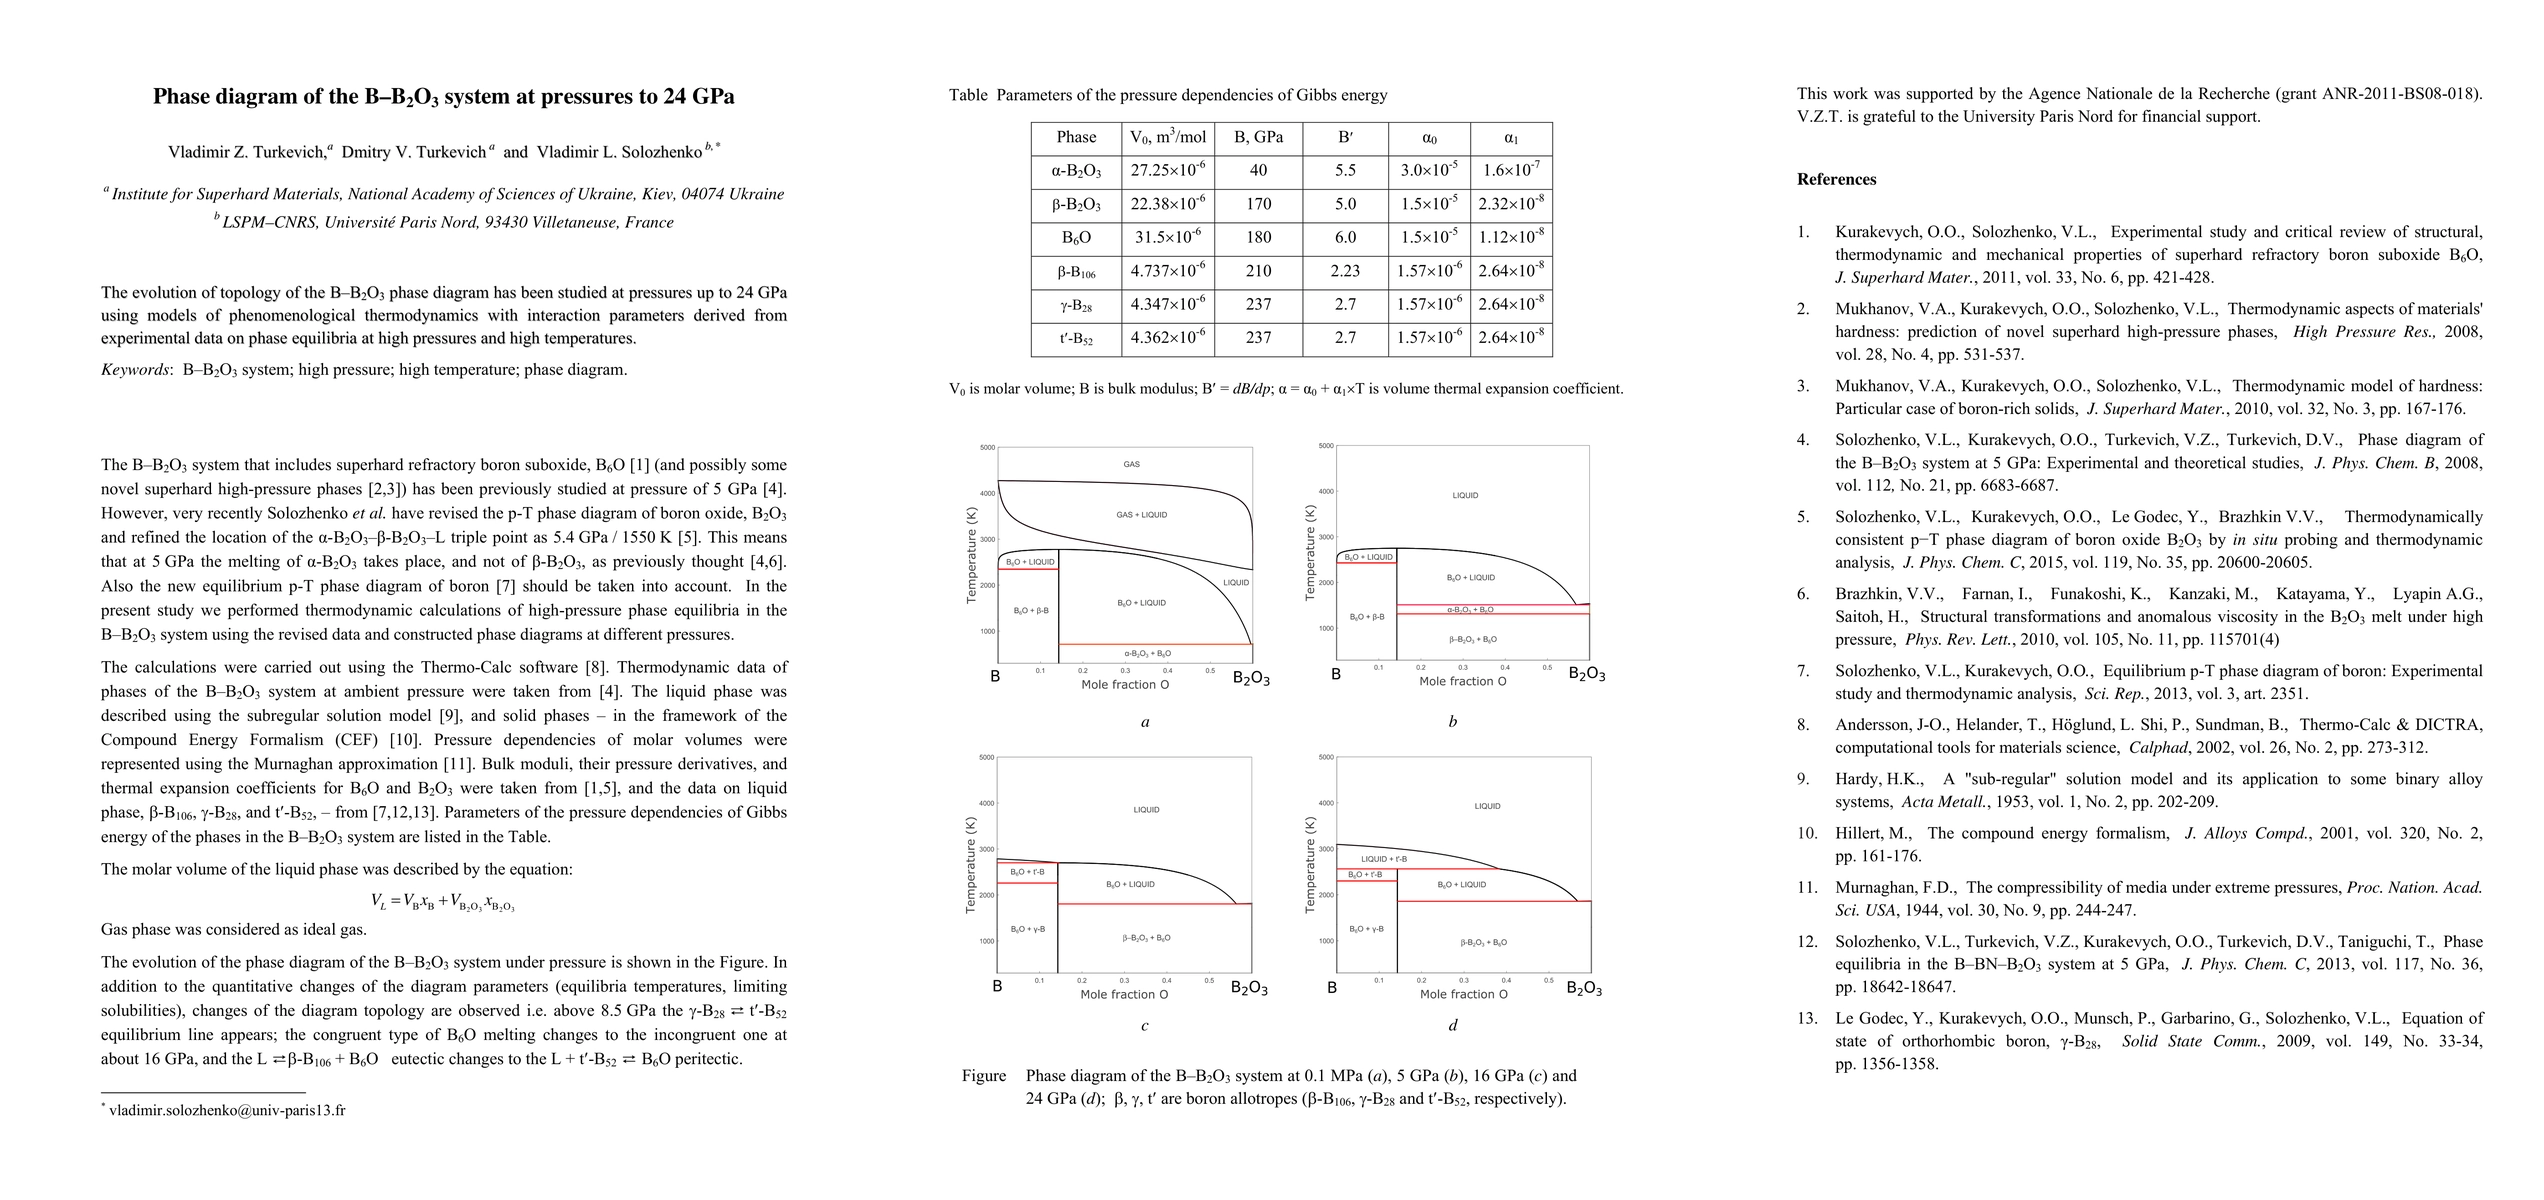
The evolution of topology of the B-B2O3 phase diagram has been studied at pressures up to 24 GPa using models of phenomenological thermodynamics with interaction parameters derived from experimental data on phase equilibria at high pressures and high temperatures.
AI Key Findings
Get AI-generated insights about this paper's methodology, results, and significance.
Paper Details
PDF Preview
Key Terms
gpa
(0.339)
thermodynamics
(0.298)
phenomenological
(0.284)
phase
(0.282)
phase diagram
(0.272)
experimental data
(0.269)
diagram
(0.247)
topology
(0.247)
Citation Network
Current paper (gray), citations (green), references (blue)
Display is limited for performance on very large graphs.
Current Paper
Citations
References
Click to view
| Title | Authors | Year | Actions |
|---|
Comments (0)