Publication
Metrics
AI Quick Summary
This paper reexamines the phase diagram of the 2D Ising model with competing interactions using Monte-Carlo simulations, revealing a weakly first-order transition for moderate next-nearest neighbour interactions and introducing methods to accurately determine transition temperatures near the critical point.
Paper Preview
Abstract
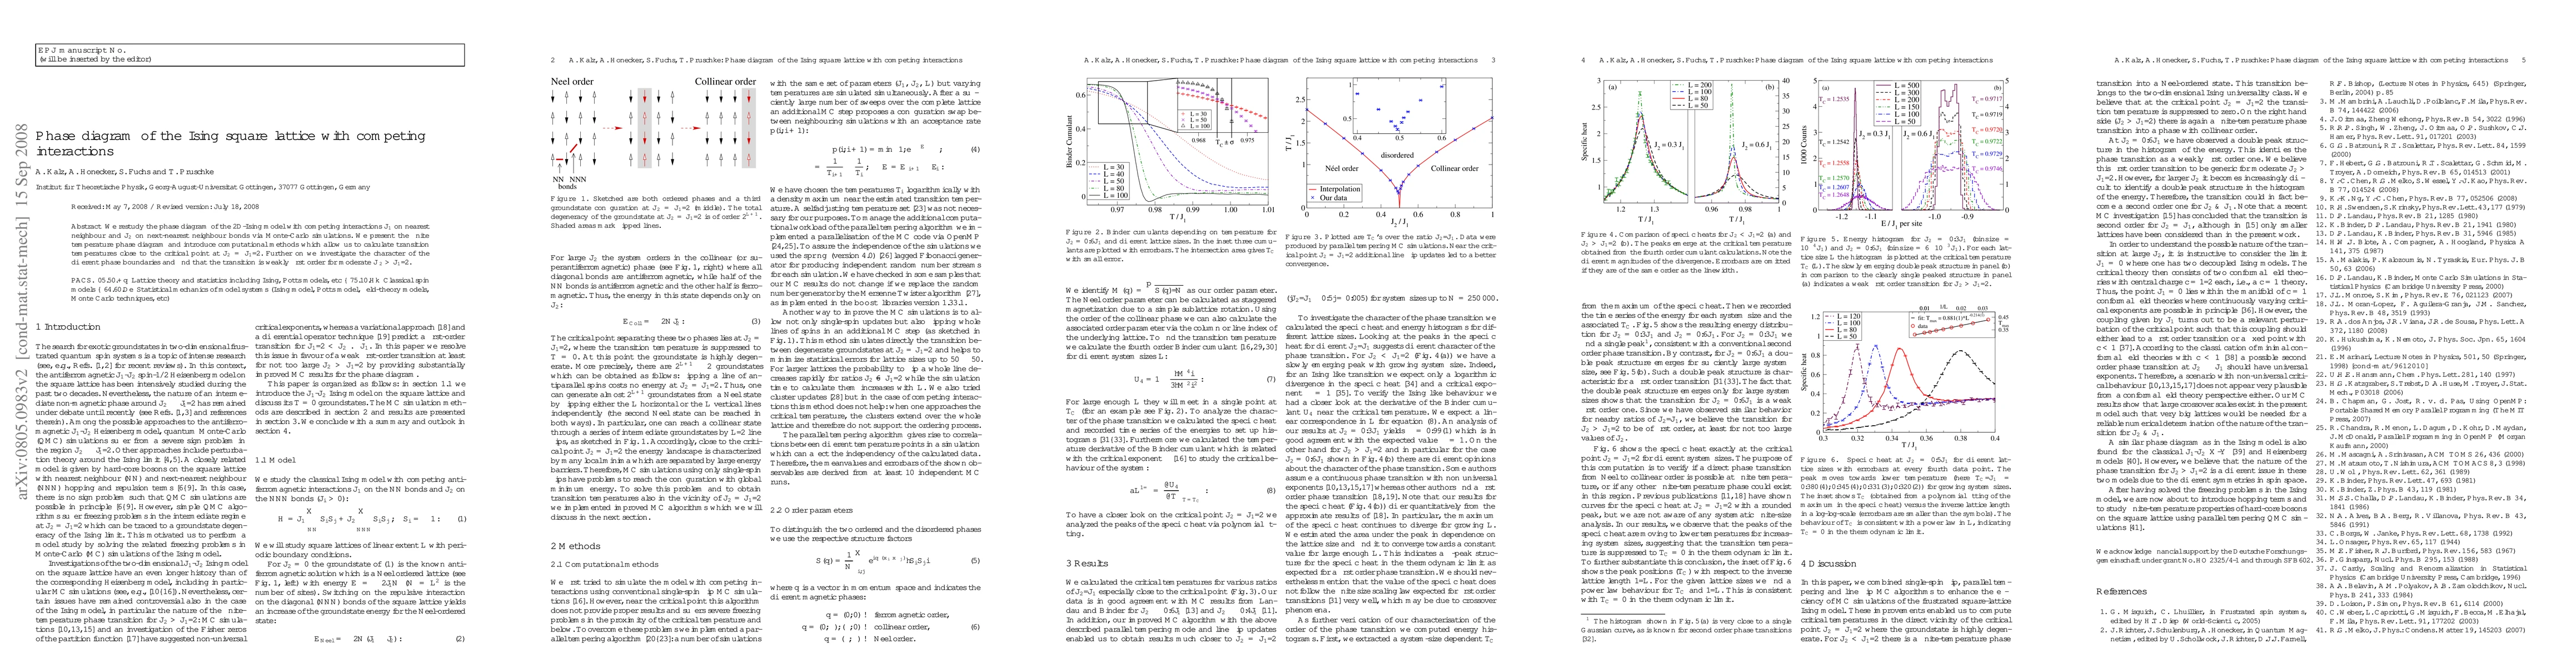
We restudy the phase diagram of the 2D-Ising model with competing interactions $J_1$ on nearest neighbour and $J_2$ on next-nearest neighbour bonds via Monte-Carlo simulations. We present the finite temperature phase diagram and introduce computational methods which allow us to calculate transition temperatures close to the critical point at $J_2 = 0.5 J_1$. Further on we investigate the character of the different phase boundaries and find that the transition is weakly first order for moderate $J_2 > 0.5 J_1$.
AI Key Findings
Get AI-generated insights about this paper's methodology, results, significance, and more — seven facets brought into focus.
Impact
Paper Details
PDF Preview
Key Terms
Citation Network
Current paper (gray), citations (green), references (blue)
Display is limited for performance on very large graphs.
Discussion 0