Phase diagram of the one-dimensional half-filled extended Hubbard model
Publication
Metrics
AI Quick Summary
The researchers studied the one-dimensional half-filled Hubbard model to create a phase diagram, confirming different phases and transition points in various regimes of coupling strength.
Paper Preview
Abstract
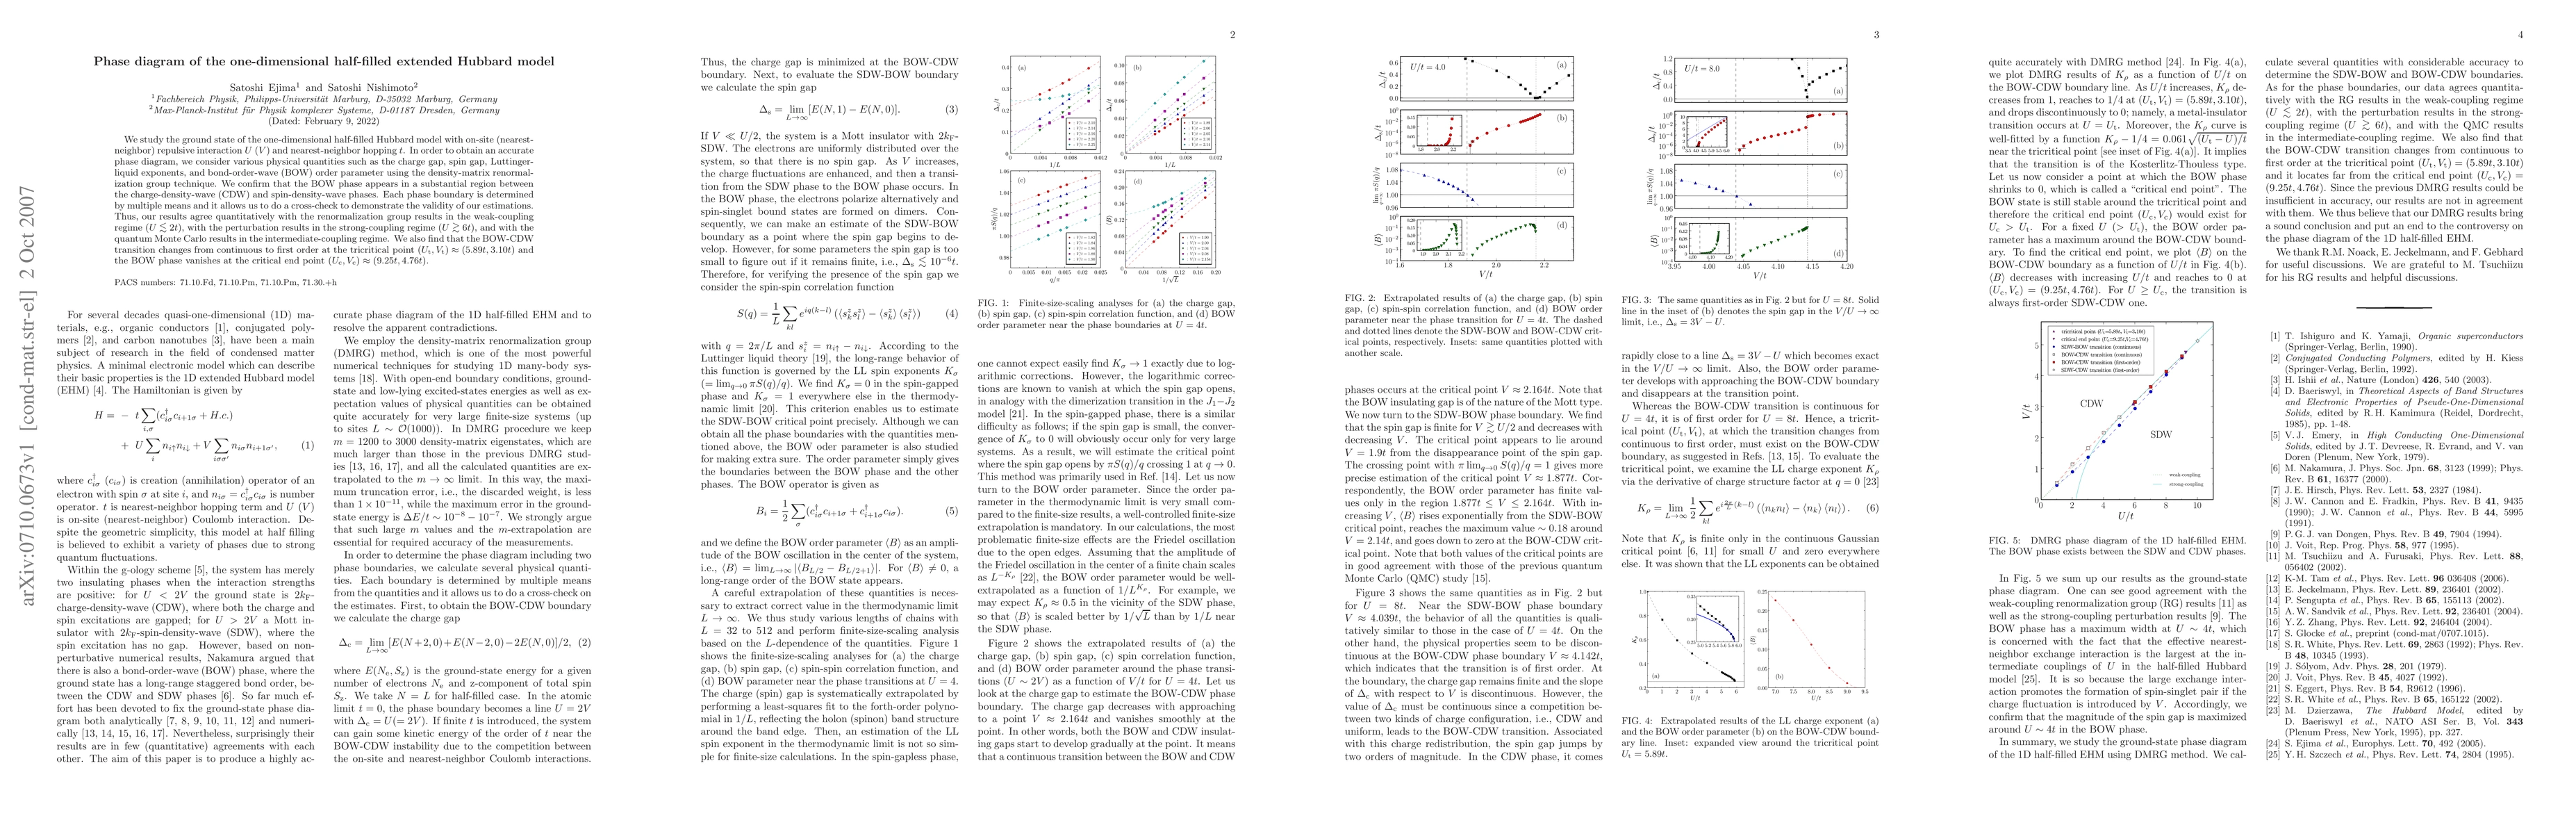
We study the ground state of the one-dimensional half-filled Hubbard model with on-site (nearest-neighbor) repulsive interaction $U$ ($V$) and nearest-neighbor hopping $t$. In order to obtain an accurate phase diagram, we consider various physical quantities such as the charge gap, spin gap, Luttinger-liquid exponents, and bond-order-wave (BOW) order parameter using the density-matrix renormalization group technique. We confirm that the BOW phase appears in a substantial region between the charge-density-wave (CDW) and spin-density-wave phases. Each phase boundary is determined by multiple means and it allows us to do a cross-check to demonstrate the validity of our estimations. Thus, our results agree quantitatively with the renormalization group results in the weak-coupling regime ($U \lesssim 2t$), with the perturbation results in the strong-coupling regime ($U \gtrsim 6t$), and with the quantum Monte Carlo results in the intermediate-coupling regime. We also find that the BOW-CDW transition changes from continuous to first order at the tricritical point $(U_{\rm t}, V_{\rm t}) \approx (5.89t, 3.10t)$ and the BOW phase vanishes at the critical end point $(U_{\rm c}, V_{\rm c}) \approx (9.25t, 4.76t)$.
AI Key Findings
Get AI-generated insights about this paper's methodology, results, significance, and more — seven facets brought into focus.
Discussion 0