Publication
Metrics
AI Quick Summary
This paper maps out the phase diagram of the triangular lattice quantum Ising model using quantum Monte Carlo and density matrix renormalization group simulations, revealing transitions between BKT, UUD, and clock phases under varying external fields and temperatures, and aligns with field theoretical predictions and experimental relevance to TmMgGaO$_4$ and quantum simulators.
Paper Preview
Abstract
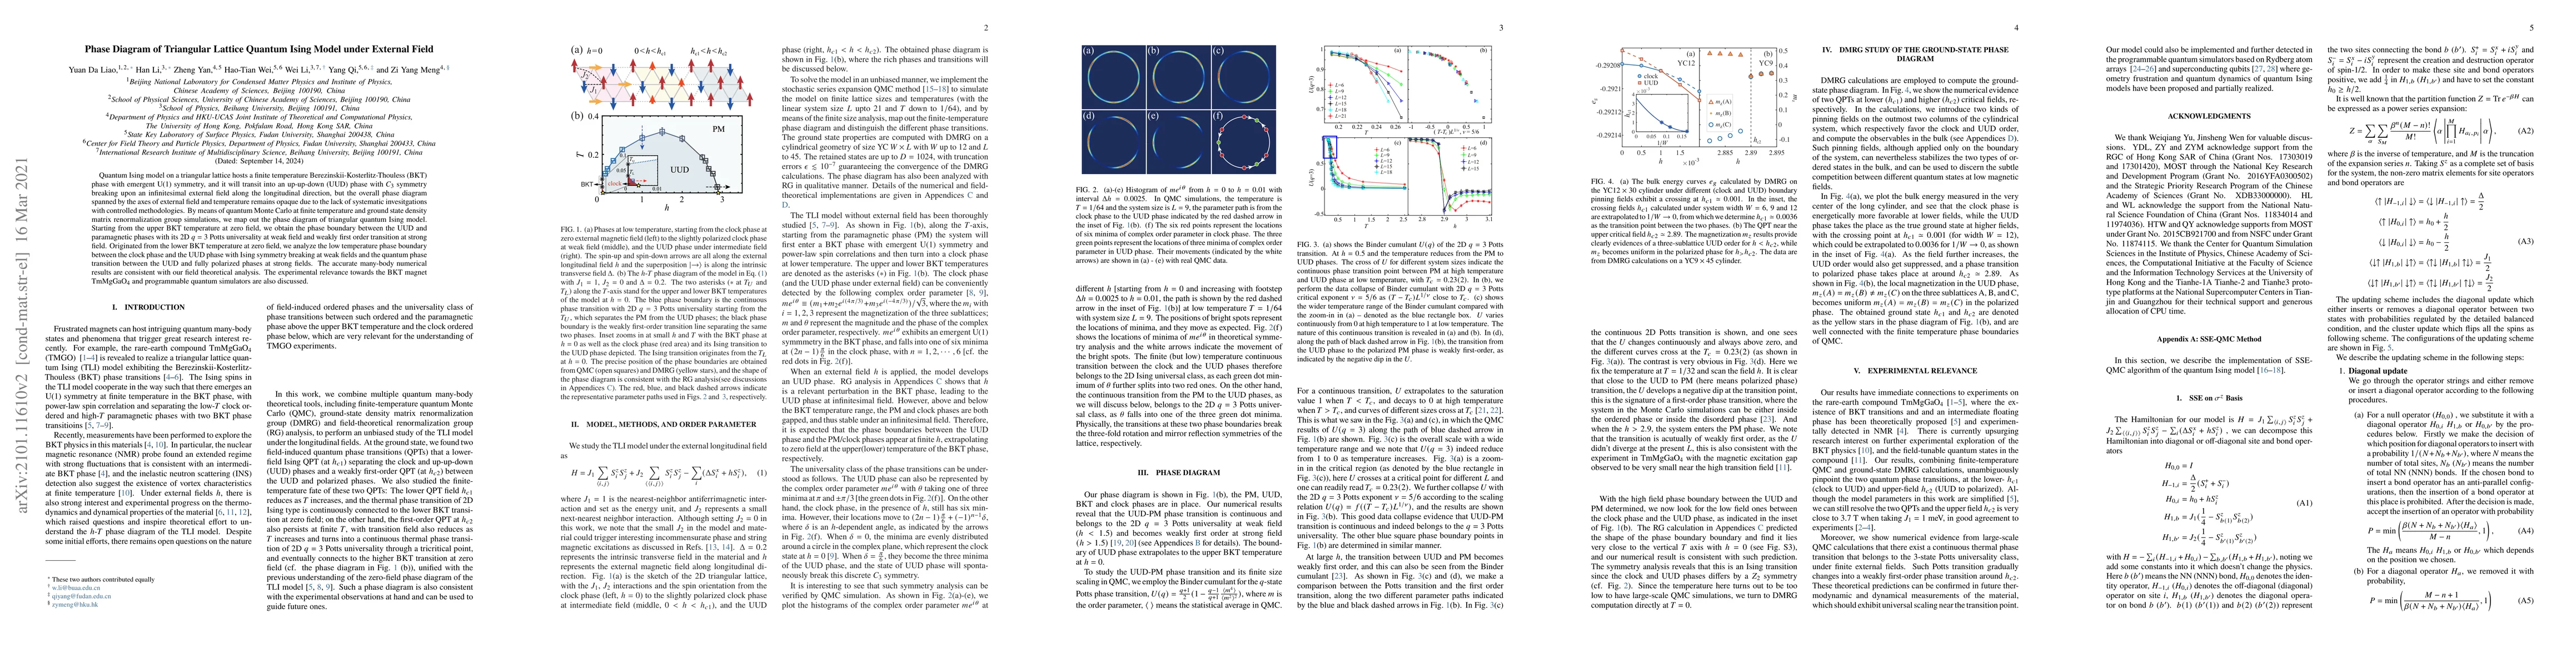
Quantum Ising model on a triangular lattice hosts a finite temperature Berezinskii-Kosterlitz-Thouless (BKT) phase with emergent U(1) symmetry, and it will transit into an up-up-down (UUD) phase with $C_3$ symmetry breaking upon an infinitesimal external field along the longitudinal direction, but the overall phase diagram spanned by the axes of external field and temperature remains opaque due to the lack of systematic invesitgations with controlled methodologies. By means of quantum Monte Carlo at finite temperature and ground state density matrix renormalization group simulations, we map out the phase diagram of triangular quantum Ising model. Stemming from the upper BKT temperature at zero field, we obtain the phase boundary between the UUD and paramagnetic phases with its 2D $q=3$ Potts universality at weak field and weakly first order transition at strong field. Originated from the lower BKT temperature at zero field, we analyze the low temperature phase boundary between the clock phase and the UUD phase with Ising symmetry breaking at weak fields and the quantum phase transition between the UUD and fully polarized phases at strong fields. The accurate many-body numerical results are consistent with our field theoretical analysis. The experimental relevance towards the BKT magnet TmMgGaO$_4$ and programmable quantum simulators are also discussed.
AI Key Findings
Get AI-generated insights about this paper's methodology, results, significance, and more — seven facets brought into focus.
Impact
Paper Details
PDF Preview
Key Terms
Citation Network
Current paper (gray), citations (green), references (blue)
Display is limited for performance on very large graphs.
Discussion 0