Phase field modeling and computation of vesicle growth or shrinkage
Publication
Metrics
AI Quick Summary
This paper introduces a phase field model for simulating vesicle growth or shrinkage driven by osmotic pressure, combining Allen-Cahn and Cahn-Hilliard equations. It develops a nonlinear numerical scheme to compute vesicle shapes, confirming $\mathcal{O}(t+h^2)$ accuracy and revealing distinct equilibrium shapes for growing and shrinking vesicles.
Paper Preview
Abstract
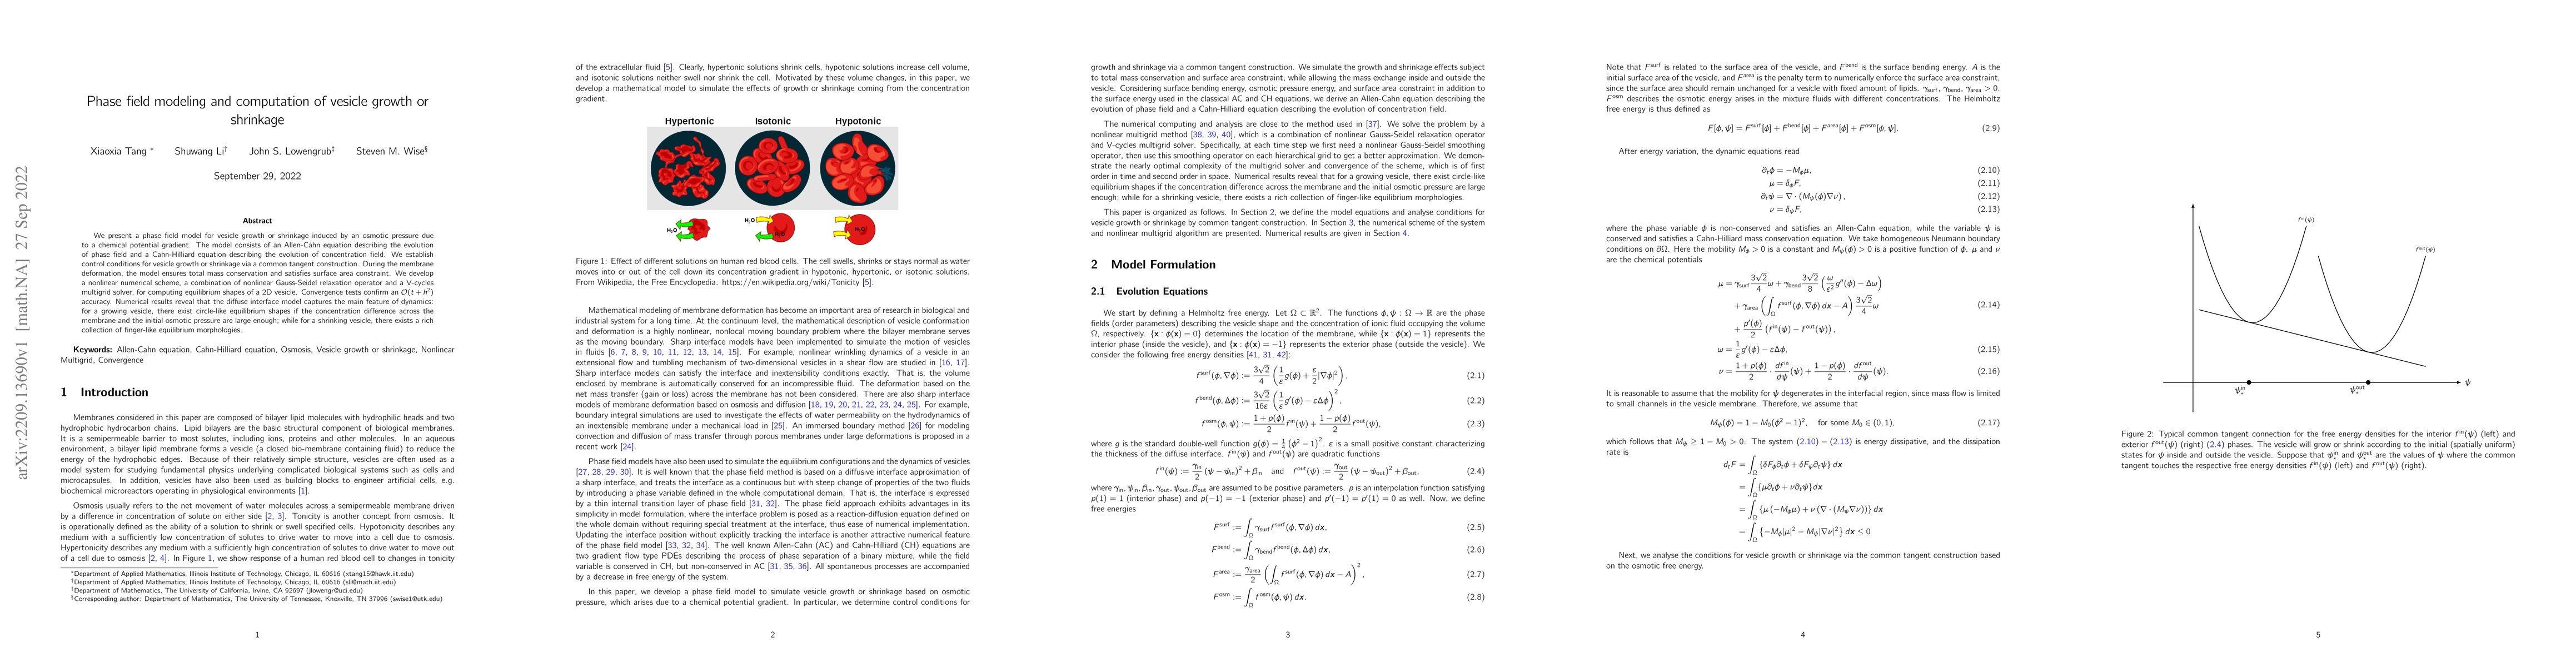
We present a phase field model for vesicle growth or shrinkage induced by an osmotic pressure due to a chemical potential gradient. The model consists of an Allen-Cahn equation describing the evolution of phase field and a Cahn-Hilliard equation describing the evolution of concentration field. We establish control conditions for vesicle growth or shrinkage via a common tangent construction. During the membrane deformation, the model ensures total mass conservation and satisfies surface area constraint. We develop a nonlinear numerical scheme, a combination of nonlinear Gauss-Seidel relaxation operator and a V-cycles multigrid solver, for computing equilibrium shapes of a 2D vesicle. Convergence tests confirm an $\mathcal{O}(t+h^2)$ accuracy. Numerical results reveal that the diffuse interface model captures the main feature of dynamics: for a growing vesicle, there exist circle-like equilibrium shapes if the concentration difference across the membrane and the initial osmotic pressure are large enough; while for a shrinking vesicle, there exists a rich collection of finger-like equilibrium morphologies.
AI Key Findings
Get AI-generated insights about this paper's methodology, results, significance, and more — seven facets brought into focus.
Impact
Paper Details
Authors
PDF Preview
Key Terms
Citation Network
Current paper (gray), citations (green), references (blue)
Display is limited for performance on very large graphs.
Discussion 0