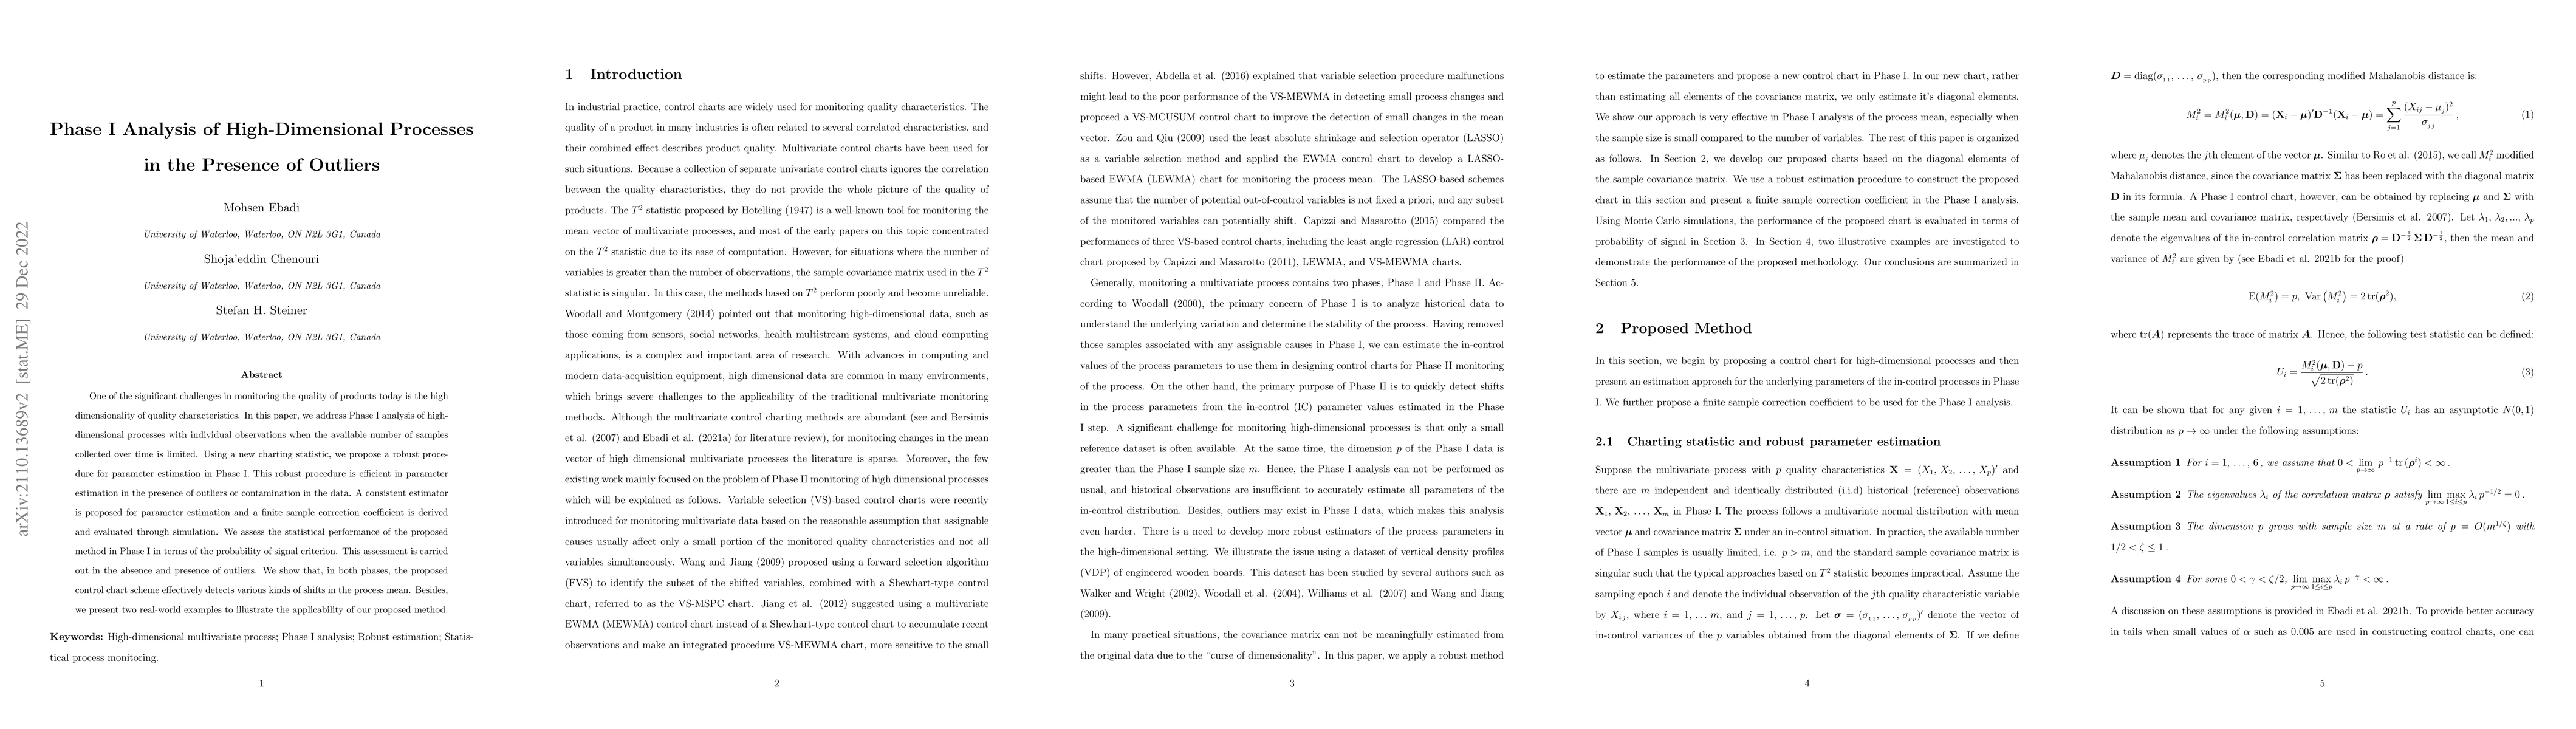
Outlier Detection in High Dimensional Data
|
C. Aggarwal, Philip S. Yu
|
2021
|
View Paper
|
Robust estimation
|
|
2021
|
View Paper
|
Semiparametric MEWMA for Phase II profile monitoring
|
Sara H. Nassar, Abdel-Salam G. Abdel-Salam
|
2021
|
View Paper
|
A two-step method for monitoring normally distributed multi-stream processes in high dimensions
|
A. Ahmadi-Javid, M. Ebadi
|
2020
|
View Paper
|
A one‐class peeling method for multivariate outlier detection with applications in phase I SPC
|
Waldyn G. Martinez, Maria L. Weese, L. A. Jones‐Farmer
|
2020
|
View Paper
|
Phase I analysis of high-dimensional covariance matrices based on sparse leading eigenvalues
|
Jinyu Fan, L. Shu, Aijun Yang, Yanting Li
|
2020
|
View Paper
|
A Simple Scale-Invariant Two-Sample Test for High-dimensional Data
|
Liang Zhang, Tianming Zhu, Jin-Ting Zhang
|
2020
|
View Paper
|
Phase Analysis
|
Lev Iosifovich Mirkin
|
2020
|
View Paper
|
Statistical monitoring of the covariance matrix in multivariate processes: A literature review
|
M. Ebadi, Shoja'eddin Chenouri, D. Lin, S. Steiner
|
2020
|
View Paper
|
A Diagnostic Procedure for High-Dimensional Data Streams via Missed Discovery Rate Control
|
Wendong Li, D. Xiang, F. Tsung, X. Pu
|
2019
|
View Paper
|
Variable Selection‐based Multivariate Cumulative Sum Control Chart
|
G. Abdella, K. Al-Khalifa, Sangahn Kim, M. Jeong, E. Elsayed, A. Hamouda
|
2017
|
View Paper
|
Outlier detection for high-dimensional data
|
Kwang-Ho Ro, Changliang Zou, Zhaojun Wang, G. Yin
|
2015
|
View Paper
|
Robust Control Charts for Monitoring Process Variability in Phase I Multivariate Individual Observations
|
A. Variyath, Jayasankar Vattathoor
|
2014
|
View Paper
|
Robust Estimation of Parameters in Simple Linear Profiles Using M-Estimators
|
M. Ebadi, H. Shahriari
|
2014
|
View Paper
|
Some Current Directions in the Theory and Application of Statistical Process Monitoring
|
W. Woodall, D. Montgomery
|
2014
|
View Paper
|
Robust Control Charts for Monitoring Process Mean of Phase-I Multivariate Individual Observations
|
A. Variyath, Jayasankar Vattathoor
|
2013
|
View Paper
|
Multivariate Statistical Process Control
|
Yuan Yao, Furong Gao
|
2013
|
View Paper
|
A Variable-Selection-Based Multivariate EWMA Chart for Process Monitoring and Diagnosis
|
Wei Jiang, Kaibo Wang, F. Tsung
|
2012
|
View Paper
|
Robust estimation of parameters in multivariate processes
|
M. Ebadi, Hamid Shahriari, M. Abdollahzadeh, Aram Bahrini
|
2011
|
View Paper
|
A Least Angle Regression Control Chart for Multidimensional Data
|
G. Capizzi, G. Masarotto
|
2011
|
View Paper
|
Testing the equality of several covariance matrices with fewer observations than the dimension
|
M. Srivastava, H. Yanagihara
|
2010
|
View Paper
|
Multivariate Statistical Process Control Using LASSO
|
Changliang Zou, P. Qiu
|
2009
|
View Paper
|
High-Dimensional Process Monitoring and Fault Isolation via Variable Selection
|
Kaibo Wang, Wei Jiang
|
2009
|
View Paper
|
A Multivariate Robust Control Chart for Individual Observations
|
Shoja'eddin Chenouri, S. Steiner, A. Variyath
|
2009
|
View Paper
|
A test for the mean vector with fewer observations than the dimension under non-normality
|
M. Srivastava
|
2009
|
View Paper
|
Detecting outliers in complex profiles using a χ2 control chart method
|
Hang Zhang, S. Albin
|
2009
|
View Paper
|
A test for the mean vector with fewer observations than the dimension
|
M. Srivastava, M. Du
|
2008
|
View Paper
|
Statistical monitoring of nonlinear product and process quality profiles
|
James D. Williams, W. Woodall, J. Birch
|
2007
|
View Paper
|
Distribution of Hotelling's T2 Statistic Based on the Successive Differences Estimator
|
James D. Williams, W. Woodall, J. Birch, J. Sullivan
|
2006
|
View Paper
|
Some Tests Concerning the Covariance Matrix in High Dimensional Data
|
M. Srivastava
|
2005
|
View Paper
|
Using Control Charts to Monitor Process and Product Quality Profiles
|
W. Woodall, D. Spitzner, D. Montgomery, Shilpa Gupta
|
2004
|
View Paper
|
Robust Estimation in Multivariate Control Charts for Individual Observations
|
N. J. A. Vargas, Jose Alberto
|
2003
|
View Paper
|
Comparing Curves Using Additive Models
|
E. Walker, S. P. Wright
|
2002
|
View Paper
|
Controversies and Contradictions in Statistical Process Control
|
W. Woodall
|
2000
|
View Paper
|
Influence Function and Efficiency of the Minimum Covariance Determinant Scatter Matrix Estimator
|
C. Croux, G. Haesbroeck
|
1999
|
View Paper
|
A Fast Algorithm for the Minimum Covariance Determinant Estimator
|
P. Rousseeuw, K. V. Driessen
|
1999
|
View Paper
|
ON THE COMPARISON OF SEVERAL MEAN VALUES: AN ALTERNATIVE APPROACH
|
B. L. Welch
|
1951
|
View Paper
|
Synthesis of variance
|
F. E. Satterthwaite
|
1941
|
View Paper
|
On Monitoring High-Dimensional Multivariate Processes with Individual Observations
|
M. Ebadi
|
2021
|
View Paper
|
for multivariate outlier detection with applications in phase I SPC.Quality and Reliability
|
|
2021
|
|
Comparison of Phase II Control Charts Based on Variable Selection Methods
|
G. Capizzi, G. Masarotto
|
2015
|
View Paper
|
双対平坦空間におけるLeast Angle Regressionと情報量規準
|
廣瀬善大, 駒木文保
|
2009
|
View Paper
|
Research Multivariate Statistical Process Control Charts : An Overview
|
S. Bersimis, S. Psarakis, J. Panaretos
|
2007
|
View Paper
|
Testing Statistical Hypotheses
|
G. Casella, I. Olkin, S. Fienberg
|
2005
|
View Paper
|
To prove Theorem 1, we follow the notations in
|
|
2005
|
|
in Diagnostic
|
T. Hawley, Robert G. Hawley
|
2005
|
View Paper
|
Phase I Monitoring of Nonlinear Profiles
|
James D. Williams, W. Woodall, J. Birch
|
2003
|
View Paper
|
Small sample corrections for LTS and MCD
|
Greet Pison, S. Aelst, Gert Willems
|
2002
|
View Paper
|
A robust Hotelling test
|
G. Willems, Greet Pison, P. Rousseeuw, S. Aelst
|
2002
|
View Paper
|
B27] This type of simulation approach to finding a finite sample correction for test statistics has been used in literature
|
|
2002
|
|
: distribution of
|
Raúl Contreras-Medina, I. Luna‐Vega, César A. Ríos-Muñoz
|
2000
|
View Paper
|
EFFECT OF HIGH DIMENSION: BY AN EXAMPLE OF A TWO SAMPLE PROBLEM
|
Z. Bai
|
1999
|
View Paper
|
Multivariate Quality Control-illustrated by the air testing of sample bombsights
|
H. Hotelling
|
1947
|
View Paper
|
An approximate distribution of estimates of variance components.
|
F. E. Satterthwaite
|
1946
|
View Paper
|
Compute A = A 2 / A 1 by element-wise division of the two vectors A 2 and A 1
|
|
|
|
Compute the sample mean and sample diagonal matrix based on the generated sample in step 1
|
|
|
|
[A2 E V 2 jk h i ¼ tr E W j W 0 j h i E W k W 0 k (cid:5) (cid:6) (cid:10) (cid:11) ¼ tr I m ð Þ ¼ m ¼ E V jj ½ (cid:5)
|
|
|
|
Generate a large number of observations (e.g. L = 10000) from the same distribution and compute the corresponding values of statistic U i based on the estimates in step 2
|
|
|
|
Choose arbitrary values for p and m , consider a multi-variate normal process with known parameters l and D , and generate m multivariate normal observations based on these parameters
|
|
|
|
Generate L observations from the univariate standard normal distribution. Modify each observation by adding the corresponding Cornish-Fisher value Eq. [4] based on the exact values of l and D
|
|
|
|
Comments (0)