Publication
Metrics
AI Quick Summary
This paper presents a novel technique for de-confusing spectral lines in line intensity mapping, enabling the reconstruction of the three-dimensional spatial distribution of line-emitting sources. The method iteratively extracts sources using spectral templates and sparse approximation, successfully identifying sources even at low signal levels amidst noise and foreground contamination.
Paper Preview
Abstract
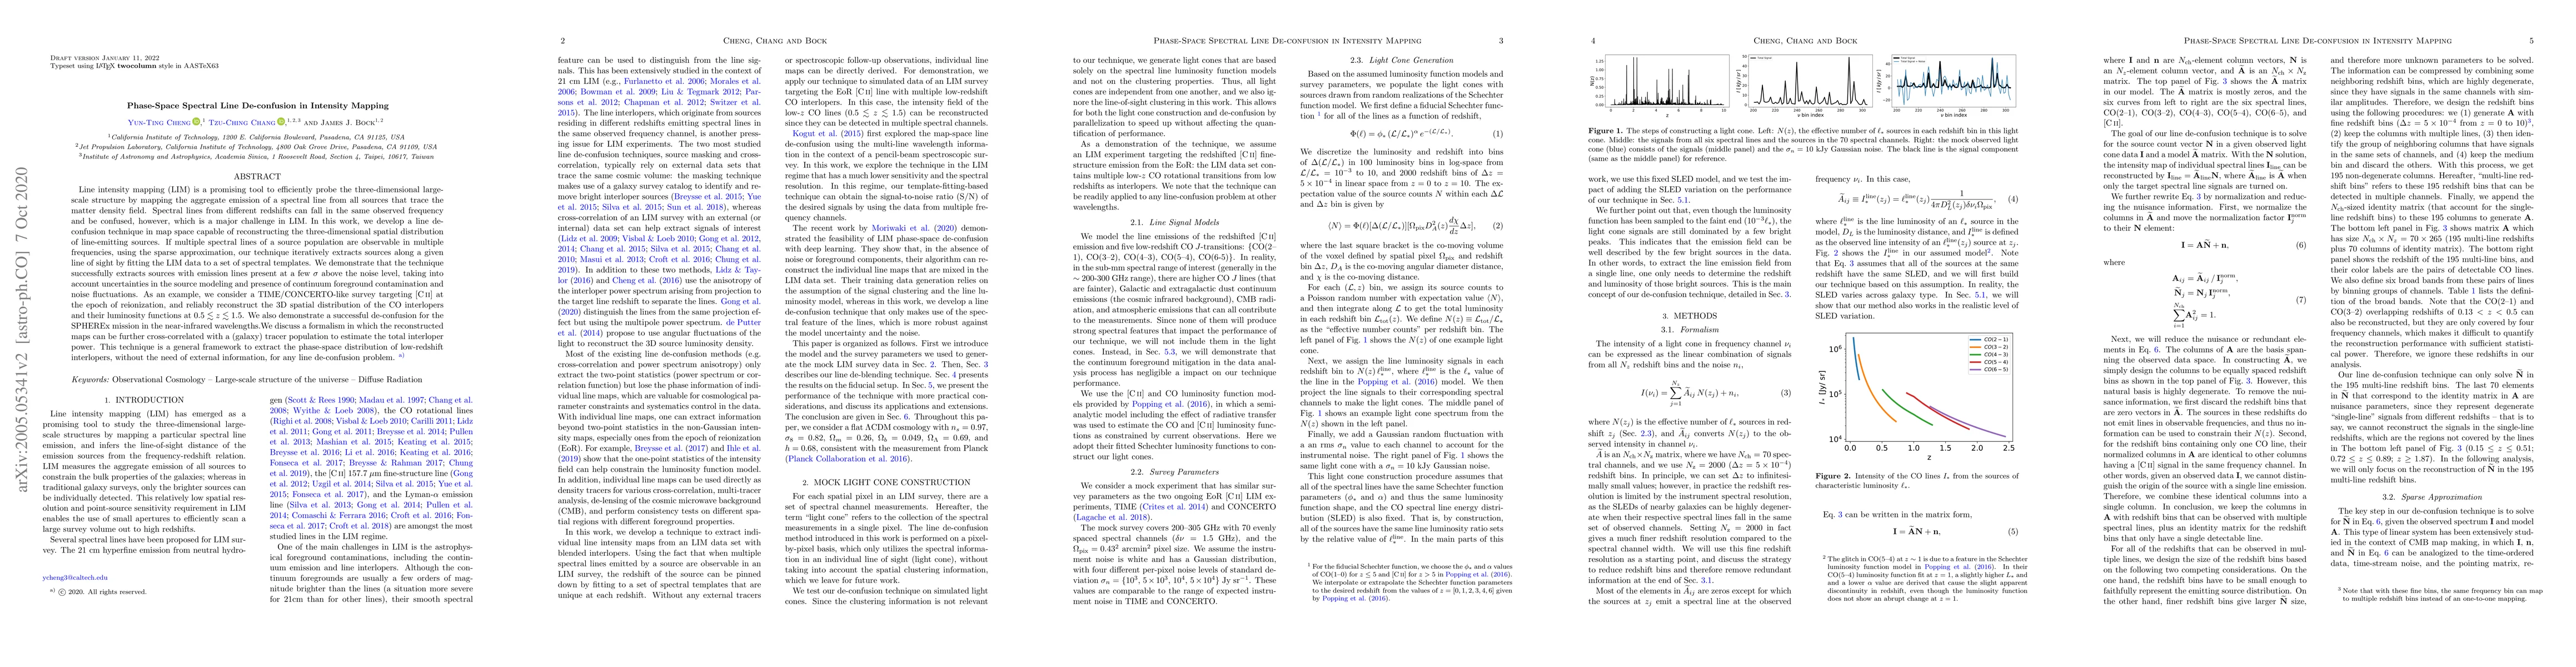
Line intensity mapping (LIM) is a promising tool to efficiently probe the three-dimensional large-scale structure by mapping the aggregate emission of a spectral line from all sources that trace the matter density field. Spectral lines from different redshifts can fall in the same observed frequency and be confused, however, which is a major challenge in LIM. In this work, we develop a line de-confusion technique in map space capable of reconstructing the three-dimensional spatial distribution of line-emitting sources. If multiple spectral lines of a source population are observable in multiple frequencies, using the sparse approximation, our technique iteratively extracts sources along a given line of sight by fitting the LIM data to a set of spectral templates. We demonstrate that the technique successfully extracts sources with emission lines present at a few $\sigma$ above the noise level, taking into account uncertainties in the source modeling and presence of continuum foreground contamination and noise fluctuations. As an example, we consider a TIME/CONCERTO-like survey targeting [C II] at the epoch of reionization, and reliably reconstruct the 3D spatial distribution of the CO interlopers at $0.5\lesssim z\lesssim 1.5$. We also demonstrate a successful de-confusion for the SPHEREx mission in the near-infrared wavelengths. Potentially, the reconstructed maps can be further cross-correlated with a (galaxy) tracer population to estimate the total interloper power in the linear clustering regime. This technique is a general framework to extract the phase-space distribution of low-redshift interlopers, without the need of external information, for any line de-confusion problem.
AI Key Findings
Get AI-generated insights about this paper's methodology, results, significance, and more — seven facets brought into focus.
Impact
Paper Details
Authors
PDF Preview
Key Terms
Citation Network
Current paper (gray), citations (green), references (blue)
Display is limited for performance on very large graphs.
Discussion 0