Publication
Metrics
AI Quick Summary
This paper investigates the statistical properties of bilateral trade imbalances, revealing a phase transition around 1960, marking a shift from a stable distribution to a dilated one, indicative of increased global economic interdependence. The new regime shows a universal master curve when rescaled by global GDP, coinciding with the onset of the last globalization wave.
Paper Preview
Abstract
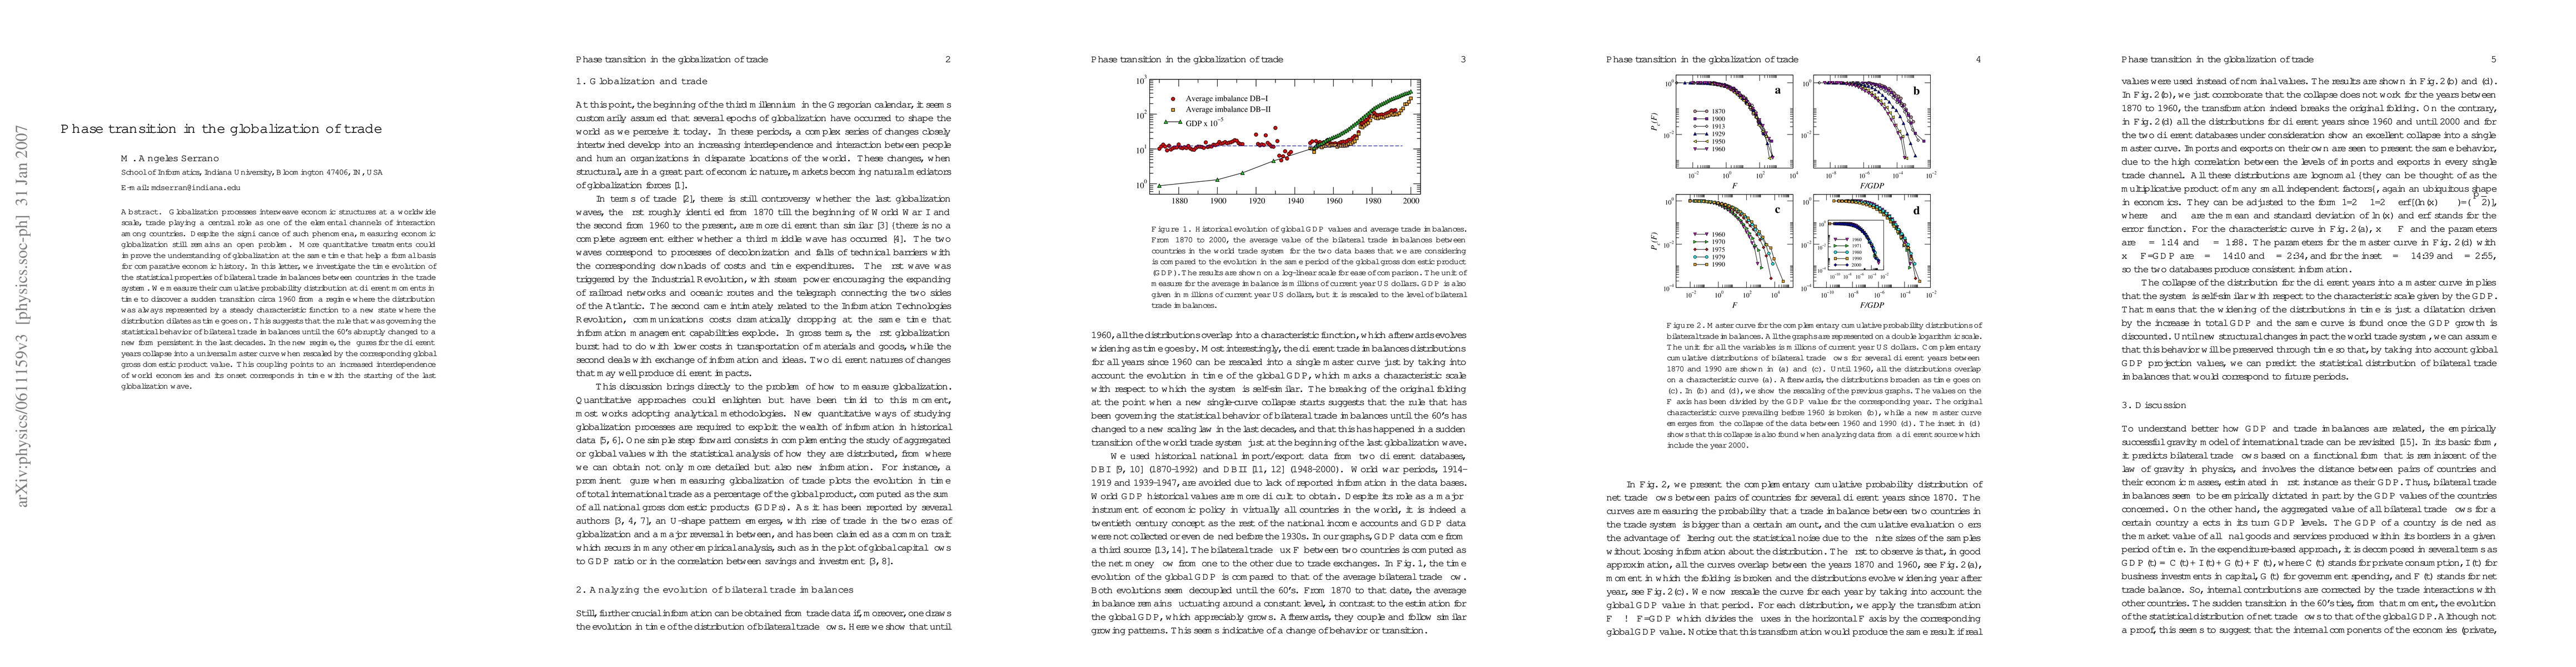
Globalization processes interweave economic structures at a worldwide scale, trade playing a central role as one of the elemental channels of interaction among countries. Despite the significance of such phenomena, measuring economic globalization still remains an open problem. More quantitative treatments could improve the understanding of globalization at the same time that help a formal basis for comparative economic history. In this letter, we investigate the time evolution of the statistical properties of bilateral trade imbalances between countries in the trade system. We measure their cumulative probability distribution at different moments in time to discover a sudden transition circa 1960 from a regime where the distribution was always represented by a steady characteristic function to a new state where the distribution dilates as time goes on. This suggests that the rule that was governing the statistical behavior of bilateral trade imbalances until the 60's abruptly changed to a new form persistent in the last decades. In the new regime, the figures for the different years collapse into a universal master curve when rescaled by the corresponding global gross domestic product value. This coupling points to an increased interdependence of world economies and its onset corresponds in time with the starting of the last globalization wave.
AI Key Findings
Get AI-generated insights about this paper's methodology, results, significance, and more — seven facets brought into focus.
Impact
Paper Details
PDF Preview
Citation Network
Current paper (gray), citations (green), references (blue)
Display is limited for performance on very large graphs.
Discussion 0